Part III: Water Drop Adventures Glossary of Explanations and Definitions
Here, you will find a sort of glossary of terms and concepts used in our story that deserve more complete definitions or explanations. Many of them are abbreviated and/or simplified to clarify some discussions, but all are designed to make your water adventures and learning experiences more efficient, enjoyable, and fulfilling. Each number coincides with the flagged number in the text of the story.
E1: When the air is cooled to its dew point, it loses its capacity to hold its water in the vapor state. Each air parcel has a different dew point temperature, depending on the total amount of water in the air. When the dew point is reached, relative humidity is near 100%, and since the air is now saturated, condensation may begin. Water vapor may begin to change phase to liquid water drops. This can also happen when air near saturation comes in contact with a colder surface, chilling a thin layer of surface air to its dew point, so that it deposits dew on that surface. It can also happen when air parcels rise, expand, and cool to their dew points, causing clouds to billow higher. Condensation commonly occurs over the cold water along our coast, especially during late spring and summer when air masses come in contact with our cold California Current, chilling air parcels to their dew points. This helps to explain why layers of low clouds and fog are so prevalent along our coast, especially during late spring and summer months.
E2: Scientists can also measure the total amount of water in any given air parcel. They use specific humidity (the mass of water vapor in a given mass of air) or absolute humidity (the mass of water vapor in a given volume of air). This differs from relative humidity, which measures the amount of water in the air versus the amount of water the air can hold at that temperature (and other conditions). However, adding more total water to the air (or, increasing specific and absolute humidity) can also bring the air parcel closer to its dew point, increasing relative humidity. California experiences low specific humidities when cold, dry, continental air masses invade from the north. High specific humidites are common in subtropical air masses that might flow north toward the state from the south, or air masses originating over warm ocean waters far to the south of us. Partially thanks to our relatively cold ocean water temperatures, California’s average specific humidities remain relatively low compared to places such as Florida or the tropics (with warm ocean water temperatures), or the Midwest and East Coast during their sticky summers. These measurements are important since air masses containing a lot of total moisture are loaded with more latent heat ready to be released.
E3: Air parcels that become lighter and less dense than their surroundings will become buoyant, just as a piece of wood will want to rise to the surface of the water or an inflated balloon might want to rise in the air. This creates an unstable atmosphere with rising air columns that must cool as they ascend higher. This will chill these air masses closer to their dew points, or saturation temperatures, encouraging cloud formation. This is why less dense low pressure, with its rising air columns, is associated with clouds, precipitation, and storminess. In contrast, dominant high pressure systems with their sinking air masses bring stable, dry weather to most of California during the summer. But in winter, low pressure systems often sweep through, with their unstable, rising air masses, bringing instability and storminess.
E4: When the air is near 100% relative humidity, or its dew point, water vapors will condense around condensation nuclei. Hygroscopic nuclei are particularly effective in attracting water vapors, so that water drops will often form around them first and then grow larger, faster. Salt is one of the most common and efficient hygroscopic nuclei. This is especially true in California, as fresh air masses sweep in from the Pacific Ocean with suspended salt particles that were lifted from the ocean surface.
E5: When water changes state, latent (or “hidden”) heat is exchanged. (Here, we only refer to the calories exchanged during the change of state, not the calories used to increase or decrease the temperature of water that remains in the same state or phase.) Ice must absorb about 80 calories/gram just to change state to liquid water (melting). One gram of liquid water must absorb about 600 calories/gram just to change to the vapor state (evaporation). Under warm, dry air parcels, when a gram of ice quickly absorbs 680 calories, it may sublimate directly to a gram of water vapor. All of this latent heat is stored in water vapor that escapes from a surface, leaving that surface cooler. This is why your skin cools when perspiration evaporates and it also explains why surfaces covered with vegetation remain cooler during summer days as they transpire moisture into the atmosphere, in contrast to more barren surfaces on hot summer days. But the high-energy water vapor that escapes is now waiting to release its stored latent heat, and this potential energy becomes essential to the formation of turbulence and storms in our atmosphere.

When the air reaches its dew point (or saturation), each gram of higher-energy water vapor that changes phase to lower-energy liquid water droplets will release those 600 calories. This latent heat of condensation is released into the surrounding air as clouds form, encouraging the air parcels to expand and rise further, creating turbulence and instability in the growing storm. A bit more latent heat (80 calories/gram of water) is released into the clouds as higher-energy water drops freeze into lower-energy ice crystals. All of this latent heat fuels towering clouds to billow higher and grow more unstable. And so, latent heat is also the primary fuel that powers thunderstorms, tornadoes, hurricanes, and other severe storms; without it, our atmosphere and our world would be unrecognizably foreign to us. California air masses usually don’t contain as much water vapor as tropical air masses (such as those off the warm Gulf of Mexico), and this is one reason why the most violent and devastating storms (such as hurricanes in the southeast U.S. and deadly tornadoes in the Midwest) are not expected in the Golden State; our air masses don’t have as much potential energy to work with.
E6: Four basic forces control the strength and direction of the wind. The pressure gradient force sets the air in motion, pushing air out of high pressure systems and pulling it into low pressure systems. The greater the difference between high and low pressure over distance, the stronger the wind. But, the Coriolis effect pulls the wind toward its right in the northern hemisphere and toward its left in the southern hemisphere as wind passes over the spinning Earth. At higher altitudes, where frictional forces are weaker, these two forces (pressure gradient and Coriolis) are almost balanced, so that wind blows parallel to isobars (lines connecting points of equal pressure). In the northern hemisphere these winds will spin counterclockwise around lows and clockwise around highs. Frictional forces become more evident nearer to the surface, slowing the wind speed. Since the Coriolis effect is determined by the air parcel’s mass, latitude, and wind speed…as the wind speed slows, so does the Coriolis effect weaken, allowing the pressure gradient force to win the tug-of-war. This causes winds near the surface to blow counterclockwise INTO low pressure systems and clockwise OUT of high pressure systems. The fourth force acting on the curving winds is called the centripetal force. When you watch our embedded water drop or ice crystal race by in the clouds, its direction and speed is being controlled by these four forces.
E7: A series of updrafts and downdrafts can be identified and measured within storms. Clouds build and storms intensify with updrafts, while downdrafts from a storm can deliver copious amounts of precipitation toward the surface. Virga is falling precipitation that evaporates into dry air before reaching the surface. As you might expect, virga is commonly observed within California’s dry air masses, particularly those familiar to our deserts.

E8: Middle latitude wave cyclones are responsible for most of California’s precipitation events. Although they may develop at any time of year between equatorial and polar regions, they can become particularly intense during winter months in the North Pacific. As the jet stream sags south in winter, the upper level westerly flow often steers these storms into California. Since they rotate counterclockwise, the cyclones can pull warm, moist air up on their right (eastern) sides, creating warm fronts that sweep around from the south into the larger storm system. As cold air is pulled from north to south on the left (western) sides of these cyclones, cold fronts often rotate the cold air from the north down into these systems. This interaction between cold and warm air masses helps to intensify the storm. Entire, counterclockwise-spinning middle latitude wave cyclones may expand to more than 1,000 miles across as upper level winds steer the behemoths and their frontal systems toward California. Our water-drop-turned-ice-crystal was caught within such a storm.
E9: In the middle latitudes, longwaves develop in the upper level westerly wind patterns. Southerly-dipping, sagging, upper-level troughs carry low pressure storm systems as they migrate, while the northerly-bulging upper-level ridges are associated with high pressure and stable, fair weather. Also known as Rossby waves, these meanders usually (but certainly not always) migrate from west to east as they drag an assortment of strengthening and weakening surface high and low pressure cells with them. This helps to explain why our average winter rainy seasons alternate between wet and dry days as these systems migrate through. Our water drop/ice crystal was caught in one of these middle latitude wave cyclones that was supported by an upper level trough as the entire complex migrated toward our state. (In summer, those upper level steering winds shift much farther north, leaving stationary subtropical high pressure ridges to dominate our state and protect us from intruding low pressure systems.)

E10: When moist, unstable air masses approach the California coast, they abruptly encounter our coastal mountains, where they are quickly lifted higher. Enhanced instability accelerates condensation on the windward (usually west) sides of the mountains, building the clouds further in the ascending air, often producing copious amounts of orographic precipitation. Precipitation rates usually decrease dramatically on the leeward (usually east) sides of those major mountain ranges, where descending air masses dry out a bit over the inland valleys. But, the storms must then pass over the more massive and higher Sierra Nevada Mountains, where more moisture condenses and is squeezed out of the clouds on their windward (western) slopes. Winter’s storms and air masses are often disheveled and dried out by the time they descend down the leeward, or eastern backsides of those mountains that slope into California’s true deserts, helping to define the term rainshadow.
E11: The ice-crystal process is responsible for most of the precipitation that falls over California. This occurs within moist air masses rising in unstable air. Tiny ice crystals that have likely formed around various freezing nuclei high in the clouds may perceive the air as supersaturated, allowing them to better compete for available moisture in the cloud. As more super-cooled water droplets attach and freeze to these ice crystals, the crystals grow larger until they finally fall toward the ground, often incorporating more moisture and growing even larger as they fall, breaking apart, and growing again on their way down. This means that most of the rain that people experience in the Golden State starts as snow, hail, or other types of falling ice crystals, but melts before reaching the ground. The collision-coalescence process also produces some precipitation over our state, often in the form of lighter drizzle that falls as liquid droplets collide and join together as they drift down through lower-altitude stratus clouds.
E12: There are many types of six-sided ice crystals that fall on to our mountain slopes during snow storms. Since our air masses often originate over the ocean, California is more famous for its “wet” snows that fall into warmer air that is only near freezing. These mushy ice crystals are near the melting point before they hit the ground. So, they squish up against one another between smaller air pockets in heavy, wet layers with very high water content. “Dry” snows fall out of very cold storms in air well below freezing. These ice crystals are rigid, so their crystal shapes stand up between numerous, giant air pockets in a fluffy snow. Since the average water content ratio of a snowfall is around 1:10, you will get a lot more than an inch of water out of ten inches of warmer, “wet” snowfall, but you will get a lot less water out of a colder, fluffy “dry’ snow. What might seem to be details suddenly represent essential information to hydrologists, water managers, skiers, or anyone who has shoveled snow in California’s mountain resorts. As the snow accumulates throughout the winter, many of the air pockets are squeezed out, resulting in a snow pack with a lot more water content /depth or volume. Hydrologists measure the depth and water content of our snowpacks throughout the winter and into the spring. This allows hydrologists and engineers to estimate and plan for the total runoff expected into downstream reservoirs and other water infrastructure as annual late winter and spring flood seasons quickly evolve into annual drought and water distribution seasons during late summer and fall.

E13: Since the upper level jet stream usually steers middle latitude wave cyclones toward the Pacific Northwest, northern California often bears the brunt of winter storms even when the upper level steering mechanisms sag south during winter. Winter’s occasional deeper troughs send these storms farther south. Even then, unless they can draw some juicy subtropical air masses up from the south, these storm systems and fronts often fall apart before crossing around Pt. Conception or over the Transverse Ranges into southern California. This is why average annual precipitation drops off as we make our way from the Oregon Border to the Mexican Border.
E14: As air descends down the leeward sides of mountain slopes, it heats by compression and increases its capacity to hold water in the vapor state. Whatever clouds that may remain (after they have dumped much of their moisture on the higher and windward slopes facing the Pacific) often evaporate into the dry air of the high deserts or even drier low deserts, trapped in their rainshadows. So, there is also a general trend from wetter to drier climates as you traverse from west to east across California. Once you get to Death Valley and the southeastern deserts, average annual rainfall drops to around two inches. An exception to this wet windward western slopes versus dry leeward eastern slopes can be found around the Transverse Ranges that trend west-east, perpendicular to most of the state’s major mountain ranges. In those Transverse Ranges, the windward slopes often face south toward moister southern California coastal regions. The dry leeward slopes of the Transverse Ranges often face north, toward the drier continent and its deserts, such as the Antelope Valley.
E15: Snow depths frequently exceed 10 feet on the western slopes of Sierra Nevada high country before the spring thaw begins. Here is where orographic precipitation squeezes copious amounts of moisture out of winter storms. Such snow depths have been achieved within just a few days during atmospheric river events until wet winters have been known to pile well more than 20 feet of snowpack onto the slopes. This is also true in the Klamath high country and on Mt. Shasta and Lassen in northern California. But, average snowpacks are dramatically smaller as we move toward southern California mountain ranges, until we get to the mountains of San Diego County, where little or no snow might accumulate in many years, even during winter months.
E16. During recent decades and especially the last several years, California’s seasonal cycles have become less reliable when compared to established weather records that date back more than a century. Average annual thaws and spring runoffs have been peaking earlier in spring and summer, decreasing precipitation-to-runoff event lag times, and leaving less water for each late summer’s long drought. Weather anomalies and severe weather events have become more frequent and extreme. Record droughts and catastrophic fire seasons have been followed by record precipitation events and floods, costing lives and billions of dollars of damage each year. You will find other articles addressing these climate changes on this web page.
E17: You may recall our discussion of latent heat in E5. It is important to note that, in particularly dry and windy environments, such as on leeward slopes and in our high deserts, portions of snow and ice fields often gain enough energy to sublimate directly into the atmosphere. This decreases the amount of water that would otherwise have been added to the soil, groundwater, or surface flows at that particular site.
E18: Groundwater often flows and is stored within the series of interconnected joints and fractures that exist in these mountains’ granitic and other basement rocks. This water might emerge or even erupt farther downhill as natural springs within hours, days, or years after being trapped underground. Thick layers of porous sediment and sedimentary rocks that are common below California valleys, such as the Central Valley, may support very different aquifers capable of storing tremendous amounts of water over many years and even centuries. Many of these groundwater basins have been overdrafted for decades, causing their water tables to drop dramatically until some have already been depleted. In some cases, groundwater pressures below the San Joaquin Valley have been reduced until poor spaces collapse, causing dramatic surface subsidence of several feet or even meters, permanently destroying the aquifers.
E19. Once overland flow is concentrated in a channel, frictional forces decrease, and the velocity of the flow increases. A host of fluvial processes becomes apparent from here. This gives the channeled water more power to cut through the rocks and carve rills and gullies that can merge to form deep, V-shaped canyons where larger, even more powerful streams are doing their work.
These stream and river systems cut organized patterns into the land surface that may be easily recognized when looking down on a drainage basin. Most common in California in general and the Sierra Nevada in particular are dendritic drainages shaped like the merging branches or roots of a tree. However, other patterns may evolve as slopes, bedrock, topography, and other environmental factors change. For instance, rectangular patterns may form when perpendicular joints and fractures in the bedrock create connected paths of least resistance for flowing water. Trellis patterns might drain folded sedimentary rock formations, such as around portions of the Central Valley. Radial drainages might be found diverging away from singular high-country glacial peaks we call horns, or from volcanoes such as Mt. Shasta. We will explore more fluvial processes in our next story as we follow a sand grain.

E20. The stream gradient is calculated by measuring rise/run, or the elevation change over a given distance. Gravity pulls water faster down steeper gradients, and these higher velocities give streams and rivers more power to erode and transport materials. Look for turbulent whitewater, cascades, and waterfalls where gradients are steepest. Since the Sierra Nevada Mountains continue being uplifted by tectonic activity, they show many signs of steep, youthful, high-energy drainage basins that are also being quickly eroded. Generally (or ideally), after millions of years without tectonic activity, the mountains should be eroded down; as relief decreases, streams will become graded, or more in equilibrium. Millions of years of more denudation without fresh mountain building could eventually weather and erode the mountains away, leaving gradients even flatter, causing drainages to become less energetic in their old ages. Of course, we must be careful while using such terms (more associated with living organisms) to describe landscapes that are constantly in flux as they attempt to evolve toward their equilibriums, especially when new geologic forces could erupt and rejuvenate landscapes.
For instance, streams and rivers may become more powerful and cut faster due to environmental changes within their drainage basins. In California, accelerated mountain building is often the culprit. In these cases, river valleys are relatively quickly elevated by tectonic activity so that streams and rivers can slice into their former valley floors and carve through their previous deposits of sediment, leaving river (or alluvial) terraces overlooking the streams and their incisions. All of these streams are simply finding their paths of least resistance to their base levels.

We will eventually continue this discussion by following a grain of sand on our web site so that we can explore this geomorphology more thoroughly. For now, recognize that our water drop is part of this running water that is the most common and powerful external, or erosional, agent on Earth and that is certainly true throughout most of California.
E21: The Merced River may encounter some terminal moraines that were dumped by Pleistocene glaciers, or debris deposited by landslides and rockfalls. These natural barriers slow the river’s progress, causing it to meander and deposit layers of sediment during its short-lived tranquility. Yosemite Valley’s meadows are composed of such deposits that built up over centuries and are today’s foundations for rich plant communities that include riparian species.

E22. Discharge on a stream or river is measured by multiplying the cross-sectional area of the river (Area=average width X average depth) by the velocity (V) of the water. Assuming little change in the amount of water flowing through the riverbed at given points, river velocity should increase over steeper gradients, while the cross-sectional area decreases as the swifter river narrows. In contrast, when gradients decrease, the velocity of the flow slows, so that the river spreads out and its cross-sectional area increases, and it may begin looping into large meanders. The result is that we can measure discharge of the river in cubic meters per second (cms) or cubic feet per second (cfs).
Hydrologists must also estimate the timing of peak discharge on streams and rivers, or the lag times between peak precipitation and peak discharge. This is critical in California, since we have to warn downstream developments of flood potentials and decide whether to store stream flows or drain our reservoirs in anticipation of future flooding. Drainage basins with the shortest lag times tend to be smaller in area, steeper, and lacking vegetation cover that might slow water flows. The larger drainage basins with lesser gradients (and lower velocity stream flows), and protective thick forests should exhibit the longest lag times between precipitation events and peak discharge. Of course, the type of precipitation is usually the most important determining factor. Heavy rains over short periods produce much faster peak discharges compared to light rains spread over long periods of time. Peak discharge is obviously delayed when precipitation falls as snow. In that case, peak discharge will be determined by how fast it melts, especially if a warm rain event produces the thaw. So if you want to see an example of extremely quick and high peak discharges, stand in a dry wash at the bottom of a steep desert mountain range during an upstream thunderstorm; it will likely be the last flood you will ever experience. You could be buried in one of the brief but violent debris flows that have accumulated to produce the classic alluvial fans found in our arid and semi-arid landscapes.
Additionally, when vegetation is cleared by fires or developments, lag times decrease dramatically and peak discharges (though brief) increase significantly. This is why developers are often required to invest in flood control infrastructure when they build paved and other surfaces that decrease permeability. A flash flood environment is the immediate result and someone (often the taxpayers) will have to pay for flood control or the imminent flood damage and even deaths that will soon follow downstream. We have seen too many of these dramas play out in the Golden State, with all of the finger pointing and blaming and shaming that accompanies multi-million-dollar price tags that could have been avoided. They are classic examples of how we have built some dumb developments that invited disaster, while we debated how much regulation is enough. One way we are mitigating these threats is by designing more permeable surfaces into our urban and suburban environments.

E23. Referring back to E20, a stream in the degradational phase will usually appear energetic as it erodes material faster than it deposits sediment. These are often found on steep mountain slopes. A stream in the aggradational phase is depositing sediment faster than it can erode, often where the stream has drained out of steep terrain into flatter landscapes with lower relief; it may now be carrying more sediment than it can handle. In each case, these streams are seeking some kind of idealized dynamic equilibrium, which would be considered a graded stream. It is not a surprise that energetic, degradational streams are common in California, since we are located along major plate boundaries where there is active tectonic activity and relatively rapid mountain building. However, our streams may also exhibit very high sediment yields, since three big factors frequently combine here: steep slopes, freshly-weathered loose materials to work with, and lack of protective vegetation cover on the slopes. Explore our mountainous areas after a fire, when the winter rains return, and you will find streams choked with sediment. The flow is often separated into a series of tiny rivulets that attempt to navigate around deposited sediment obstructions, shaping braided stream patterns. These streams may at least briefly carry some of the greatest sediment yields/drainage basin area on Earth. Some have become flash flood environments more common to areas with badlands topography.
E24: During flooding, damage is often done by debris carried with great force through river channels. Hydrologists, geomorphologists, and engineers are on the lookout for accumulated obstructions (such as logs) that have settled in and along river beds, waiting for the next flood to carry them away. Various barriers are often constructed to catch this debris before it can attack downstream roads, infrastructure, and human developments. Also, when streams and rivers enter calm reservoirs, they deposit whatever sediment they were carrying. This sediment will build up over time until the reservoir behind a dam is filled with sediment instead of water. Each California dam and reservoir has a functional life span, or expectancy, that often depends on how fast it fills with sediment and whether that sediment can be diverted around or dredged over the obstruction to continue on down the river. Reservoirs located below drainage basins that are drained by rivers with very high sediment yields are usually first to become obsolete.

E25: The estuaries in and around the San Francisco Bay Area are flooded with brackish water, or a mix of fresh water from inland streams and rivers, combined with salt water from the ocean. As tides rise, you can see the salt water flowing from the ocean in through the Golden Gate, under the bridge and into the Bay. During the dry season and high tides, this salt water can penetrate deep into the bays all the way inland toward the Delta, which remains near or even below sea level in places. During low tide, the salt water can be seen flowing out to sea through the Golden Gate; fresh water is right behind it, flushing out toward the sea, especially during periods of peak runoff from the Sierra Nevada. These powerful currents flow around and past Alcatraz Island, which is one reason why a prison was once located there. Even if a convict made it into the cold waters, they might be helplessly swept away.
E26: The California Current is one of the most famous ocean currents on Earth. It transports cold water from north to south to chill southern latitudes and the entire California coast, especially during summer. You can thank this cold current for supporting the luxurious kelp beds, diverse marine life, and productive fisheries that help make our coastline exceptional by any global standards. This is also why you will get a quick chill if you jump in, as opposed to the warm ocean currents that dominate along our nation’s Gulf and southeast coasts. Navigators have had to chart their routes up and down the California coast to exploit the current when they were traveling south and avoid it when they were sailing north.
E27: Our storied coastal advection fog condenses when sea breezes headed for the coast flow over the cold California current and are chilled to their dew points before they make landfall. The results are much milder and even cool Mediterranean summers, until you get farther inland and away from the direct impacts of these refreshing sea breezes. Meanwhile, summer’s cool, dense, stable coastal air masses tend to settle, keeping the air from rising and becoming unstable. This enhances the annual summer dry season until general atmospheric circulation patterns can bring major changes during winter months.
E28: Prevailing winds steer the surface waters of the North Pacific Ocean into a big, clockwise-turning pinwheel called the North Pacific Gyre. As air flows out of the dominant East Pacific Subtropical High Pressure system, wind turns to its right, pushing ocean surface currents around in a giant clockwise spiral. The north-south cold California current veers to its right off Baja, Mexico and toward the west, past Hawaii, to become the warming North Equatorial Current. This current continues veering to its right off Asia and then flows as the relatively warm south-to-north Kuroshio Current, up past Japan. Another turn to its right, and our water drop has made it back toward the north Pacific near the Gulf of Alaska. There is a similar subtropical gyre around dominant subtropical high pressure in the North Atlantic Ocean. These gyres also exist in the great oceans of the Southern Hemisphere, except they turn counterclockwise, since the Coriolis effect turns fluids to their left south of the Equator.
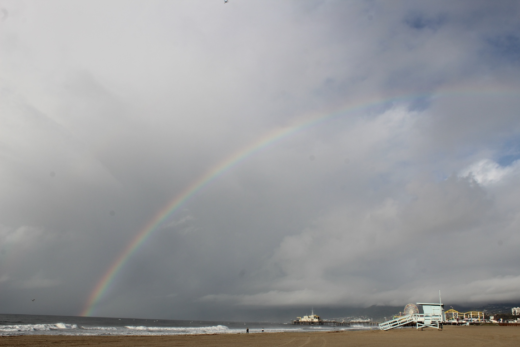
E29: What force holds water drops together? Water molecules attract one another due to their polarity. Each H2O molecule is shaped a bit like a Mickey Mouse hat, with the two hydrogens on top. The positive hydrogen side of one H2O molecule attracts the negative oxygen side of another in what is called hydrogen bonding. This is why water drops hold together and bead up on some surfaces. It is also why water exhibits surface tension so that those little water striders can skim on top of the water with their hydrophobic legs. This hydrogen bonding or clinging tension at the surface also makes it more painful to belly flop into a pool of water. And though it is true that our water drop would likely mix with others in the cycle, you can see how water drops can hold together.
When these individual drops fall as rain, that surface tension helps hold them together. When they fall into sunlight, they represent a denser substance that will slightly slow radiation that might pass through the drop. Sunlight includes all the colors of the spectrum and when this light enters a raindrop at a critical angle, it is refracted (bent), then reflected off the inside back of the raindrop, and refracted again out of the drop and back to the observer at between 40-42 degree angles. Because shorter wavelengths of the visible spectrum are refracted at greater angles and longer wavelengths are refracted at lesser angles, the colors are separated within each drop before they pass back to the observer. So, you will see the rainbow at a 40-42 degree angle with the sun behind you. The longer wavelengths of ROYGBIV (such as reds and oranges) will come out on top and the shorter wavelengths (such as blues and violets) will be at the bottom of the rainbow. In our photo, we viewed toward the mist suspended around the waterfall and there is our rainbow. Double rainbows are never as bright since the light has been reflected twice off the insides (or backsides) of the drops, inverting all the colors, but allowing more visible radiation to escape in the process.