Extreme weather whiplash continues to reshape our lives and landscapes. Nature demanded our attention again as autumn slogged into winter and spring 2025-26, proving the difference a year can make when wild and stubborn weather anomalies force landscapes and people to repeatedly adjust and recover, while we all look toward an uncertain future. Are these game-changing battles between baneful fire and water or simply nature’s way of finding balance? Follow me on this latest natural history tour where we explore the science behind all the hype and drama, right into spring. The six episodes cover major events from October 2025 to spring 2026, all in chronological order. We end with a wrap up epilogue and some relevant links. Should you dare to want more details for review, click on Page Two and skim down to the very end, where you will be rewarded with dynamic beach and wetlands landscapes, colorful sunsets, and some special avian visitors.
Introduction: Transmogrification in California
We need a new word to describe this. Forgive those who sense that we have entered some sort of space-time warp, when two locations and microclimates separated by just a few miles could experience such radically different atmospheres, as if they were worlds apart. But it also seems unthinkable that such remarkable changes could occur within any specific region within just one year, challenging us again to check our calendars. Old descriptors for our once more dependable seasons and weather patterns have been evolving toward unfamiliar, unlikely, exceptional, and unprecedented. Comparing the final months of the calendar years 2024 and 2025 unveils a topsy-turvy environment that repeatedly produced chaotic scenes more common to a science fiction movie. Exceptional pattern anomalies amplified again through and beyond the first months of 2026.
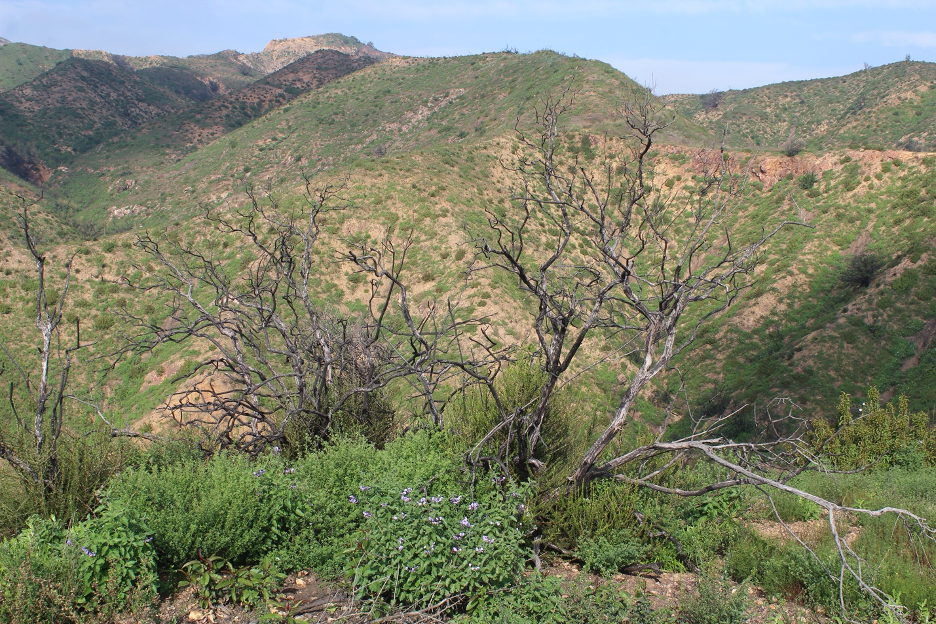
Less than 11 months before I took this photo, vegetation on these slopes at will Rogers State Park in the Pacific Palisades was burned to the ground, along with Will Rogers’ historic ranch house. By late November, 2025 the coastal sage and chaparral plant communities were already springing back, thanks to several inches of unusually early heavy rains that quickly ended the fire season. Purple nightshade, morning glory, and other early flowers joined many crown-sprouting shrubs. By the first days of January, 2026, one year after the conflagration, the slopes were already covered with thick green blankets and colorful flowers following even heavier rains.
Several years of stories on this website have documented widely researched seasonal disorders that have made news headlines each month … and they only seem to be getting weirder and more impactful. We are, at this time in this state, perfectly situated to explore and learn from these upheavals as our unparalleled diversity of microclimates, ecosystems, and landscapes continue calling out to us.
Calendar Contrariness
One year ago, our stories led you through the unprecedented weather patterns that set the stage for catastrophic historic and deadly wildfires which eventually consumed entire Southern California communities. We examined the momentous drought that left only around 1/10th of an inch of rain in the SoCal coastal plains from spring into mid-January (the middle of our rainy season). This year stood out in stark contrast as many of those same locations had already equaled or exceeded half their average annual precipitation totals by mid-November, long before what are usually the wettest months of the rainy season. But as we advanced into November, 2025, nature performed another dramatic switch. Persistent weather patterns locked into place into mid-December and they were all powerfully connected: SoCal’s seemingly endless sun and above-average temperatures in the 80s versus consecutive days of record cold, dank, and dreary valley fog; merciless warm atmospheric rivers (ARs) from the tropics that produced record catastrophic flooding in Washington contrasted with arctic blasts that plunged the upper Midwest and East Coast into the deep freeze. Yet another radical shift near the end of December (and into 2026) brought powerful storms and flooding atmospheric rivers across California during the holiday season. Another reversal to persistent, resilient high-pressure systems and winter storm blockades dried out the entire West Coast through January while historic Arctic deep freezes paralyzed the continent east of the Rockies all the way to the Eastern Seaboard. Several days of heavy rain and snow returned to California in February, only to be followed by prolonged heatwaves that produced the hottest March temperatures ever recorded in California and other southwest states and our hottest March on record. The spectacular diversity of conditions and their theatrical impacts on us and our landscapes have ranged from astounding to unnerving. There’s so much going on in this story that should keep curious observers on the edge of their seats.
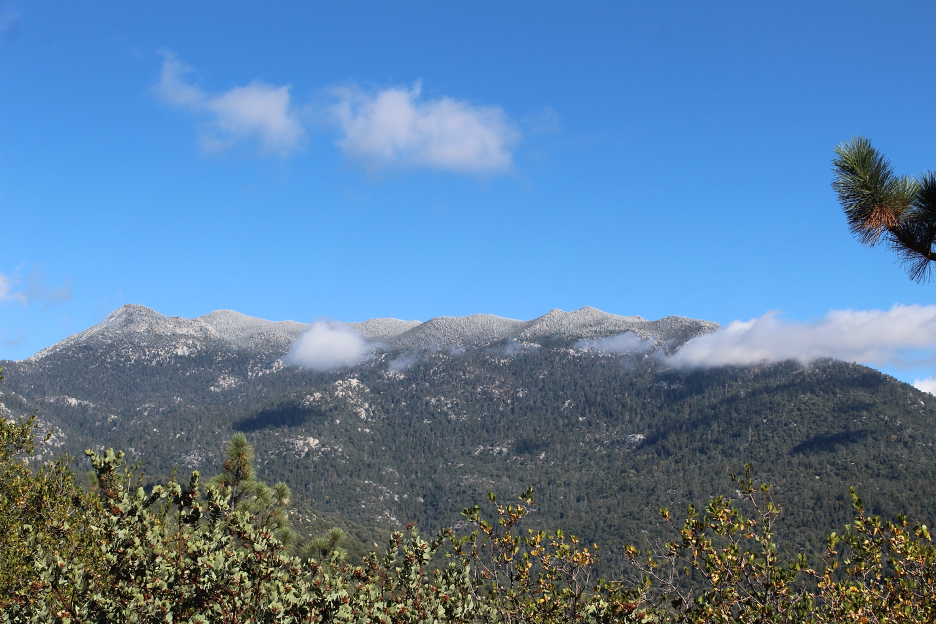
A mid-October winter-style midlatitude cyclone kicked off the 2025-26 rainy season surprisingly early. After skies cleared on Oct 15, slopes of the San Jacinto Mountains were already soaked with a few inches of rain. What a contrast from the last season, when these mountains remained bone dry well into January. Here, you can even see a light dusting of snow remaining at higher elevations as a few stratocumulus clouds drift in the fresh breezes behind the storm. This was just the start of an extraordinarily early rainy season in Southern California.
Episode One: Odd Cutoff Lows Spin Their Moisture Magic
Some of the blame for these multiple twists of fate (sometimes coined weather whiplash) started with a series of odd early-season cold and unstable upper-level low-pressure troughs that dug down from the north and broke off from general circulation patterns. November’s cutoff low repeat performers skimmed down the West Coast, mostly whirled and sprinkled through Northern California, taking the bulk of their moisture and energy with them. Then, the pesky, reenergized storms anchored and spun their turbulence over waters just off the Southern California Bight, entrained Pacific moisture, and tossed it inland. Give the National Weather Service credit for warning us about these cutoff lows that remain a weather forecaster’s woe.
As hours ticked into days, trains of steady showers circulated from Mexico up through and past Santa Barbara County. When the unstable moisture was lifted up the Transverse Ranges, heavier orographic precipitation watered the slopes and snuffed out the fire season. Soils became saturated, seasonal streams resumed flowing early, fresh green spouts appeared everywhere, and premature weeds erupted in our gardens. Since the showers were mostly beneficial and steady rather than sporadic downburst gulley washers, we were first spared the worst of flooding and debris flows that could have coughed out of our burn scars. Observers were wondering how it was possible that the hills were so alive just one calendar year after debilitating drought and Santa Ana winds had primed these same landscapes for their dehydrated fiery destruction. One of the wettest starts to our rainy season this year had transposed last year’s driest into our rear-view mirrors.
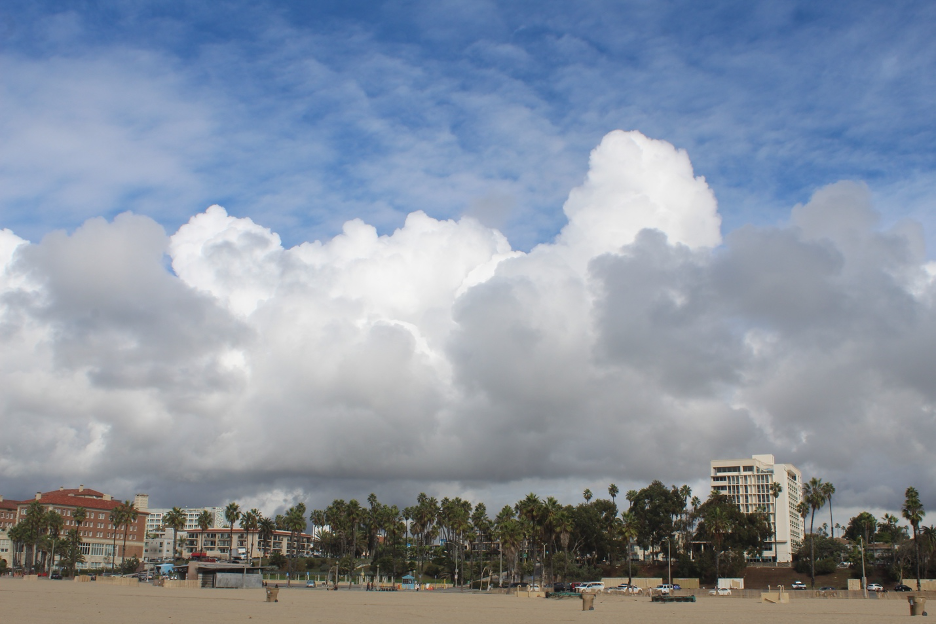
By mid-November, a series of low-pressure systems pinched off from upper-air circulation patterns and intensified off the Southern California Coast. They circulated copious amounts of moisture onshore, resulting in several inches of rain that broke records during this exceptionally wet November, 2025. During this break in the rain on November 16, heavy cumulus clouds were mushrooming up toward higher cloud layers, all of them announcing the arrival of air columns loaded with water. Precipitable water (PWAT) in air columns (the total amount of water contained in any column of air) repeatedly reached record levels within November and December atmospheric rivers.
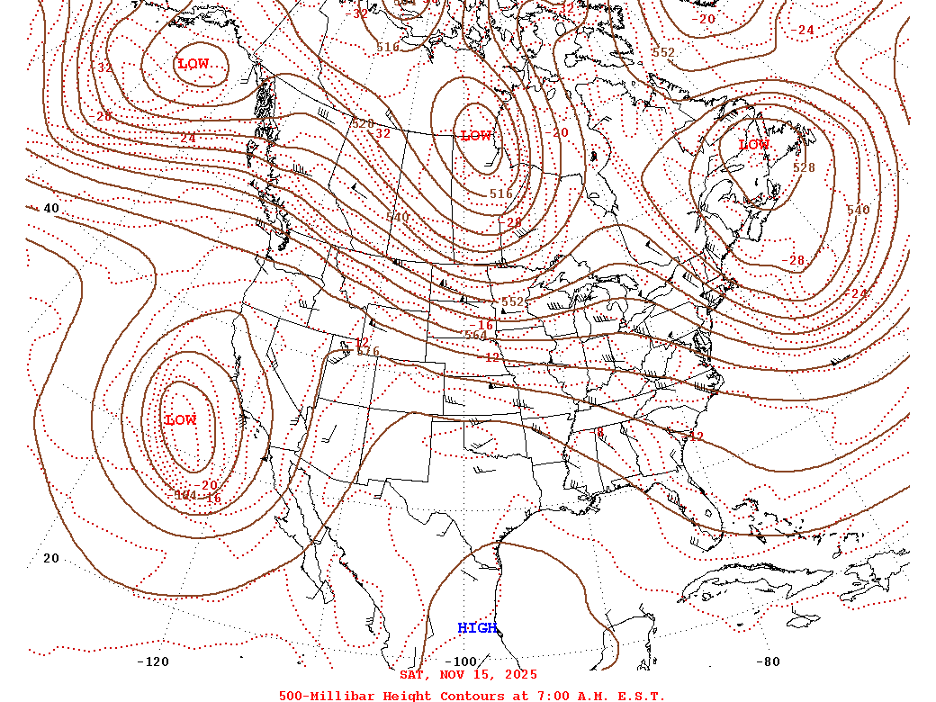
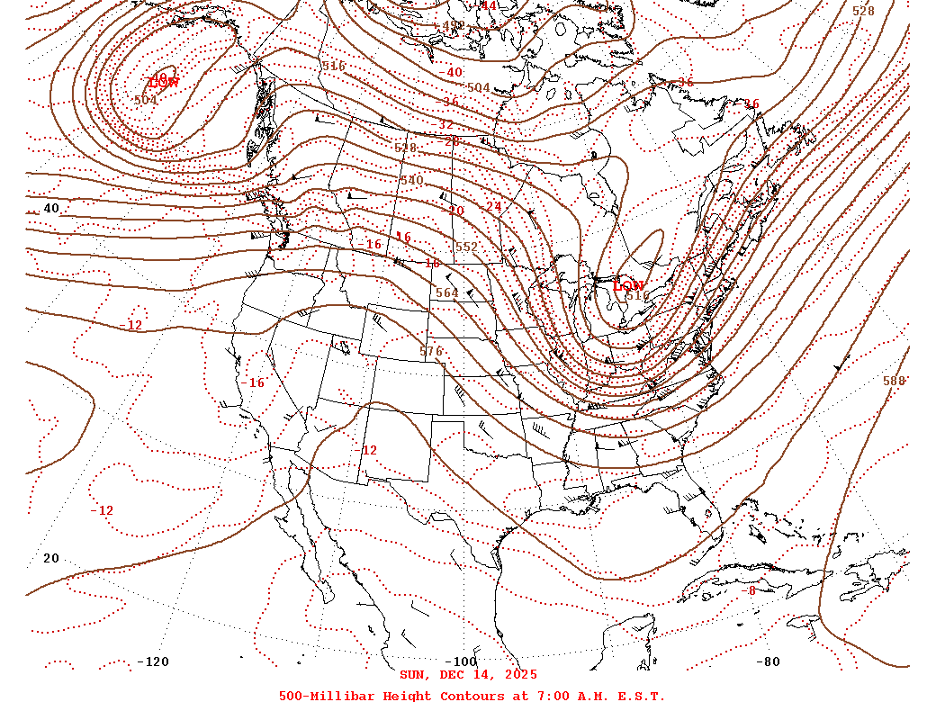
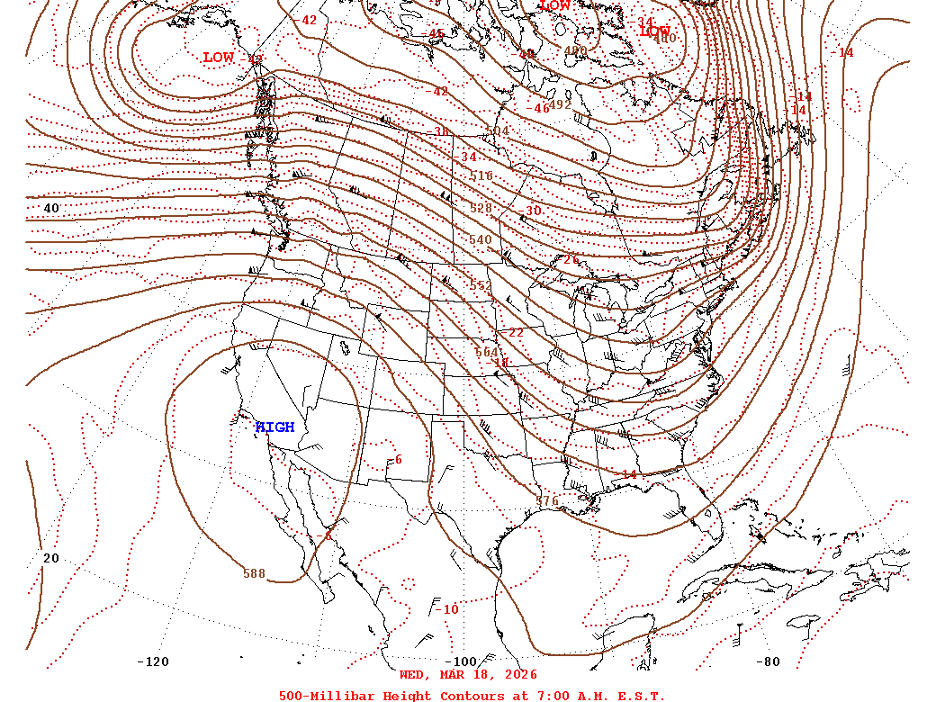
Note the exceptionally deep upper-level cutoff low that stands out off the Southern California coast on this 500mb chart (showing atmospheric pressure and winds halfway up through the atmosphere). California is on the wet and unstable east side of the low, which is driving moist air from the south directly over the state. Source: National Centers for Environmental Prediction, Weather Prediction Center.
This November 15, 2025 radar sequence shows bands of heavy rain circulating up from the south, into the Southern California Bight and up against the Transverse Ranges. The circulation is directed by that same low-pressure system shown in the previous image. Source: NOAA/National Weather Service.
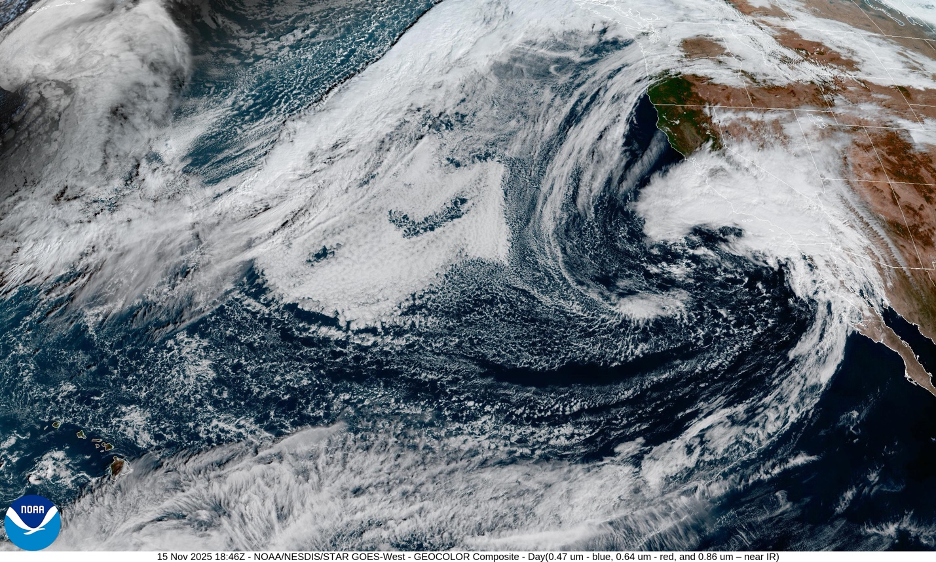
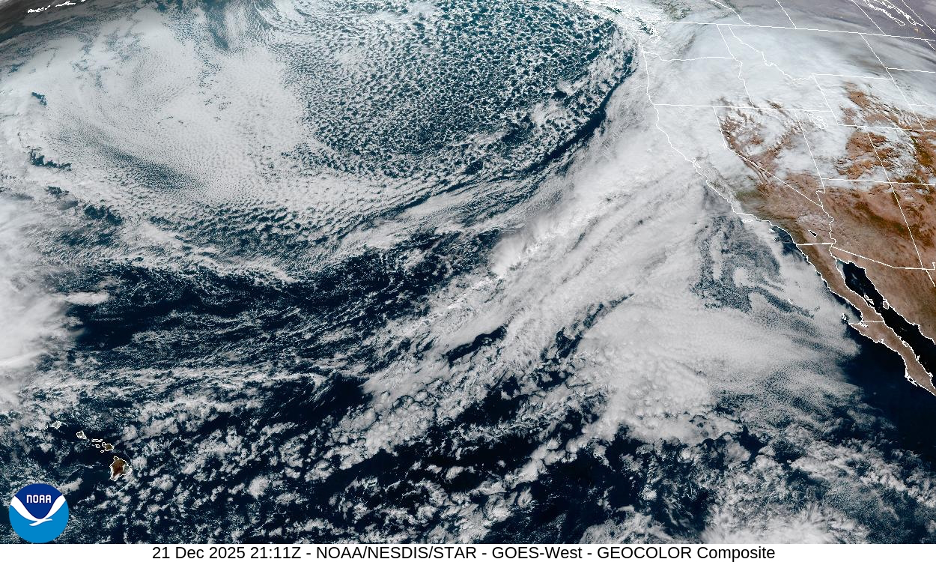
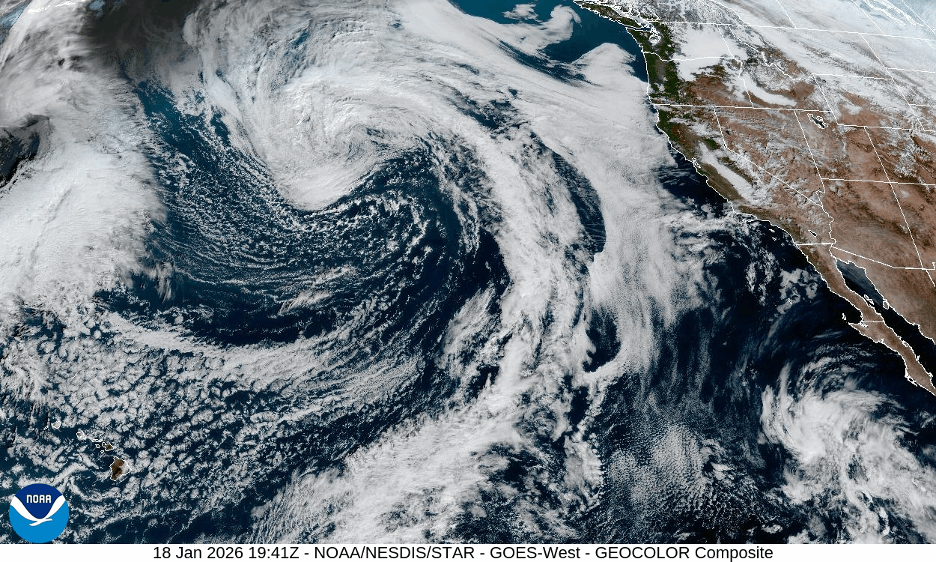
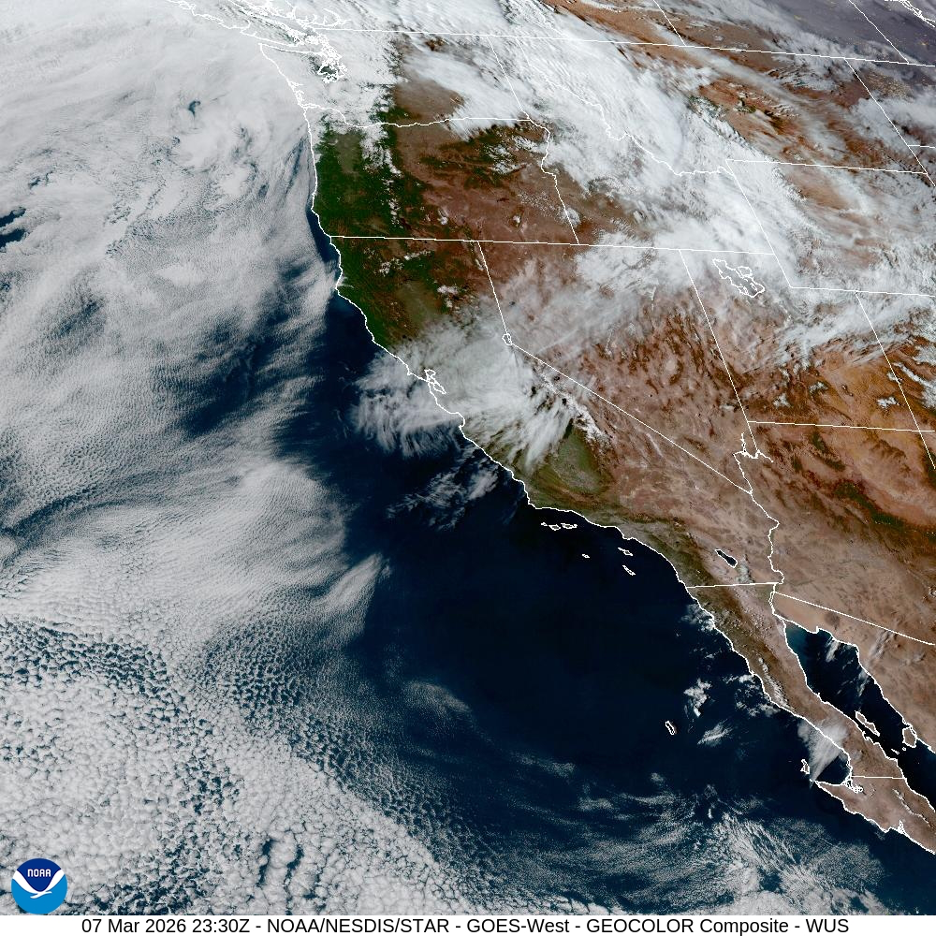
This satellite photo shows the same November 15, 2025 storm spinning precipitation into Southern and Central California. Notice the long connection to the tropics as the atmospheric river races across the Pacific (from the bottom of the screen) and is directed toward the West Coast. Source: NOAA/National Weather Service.
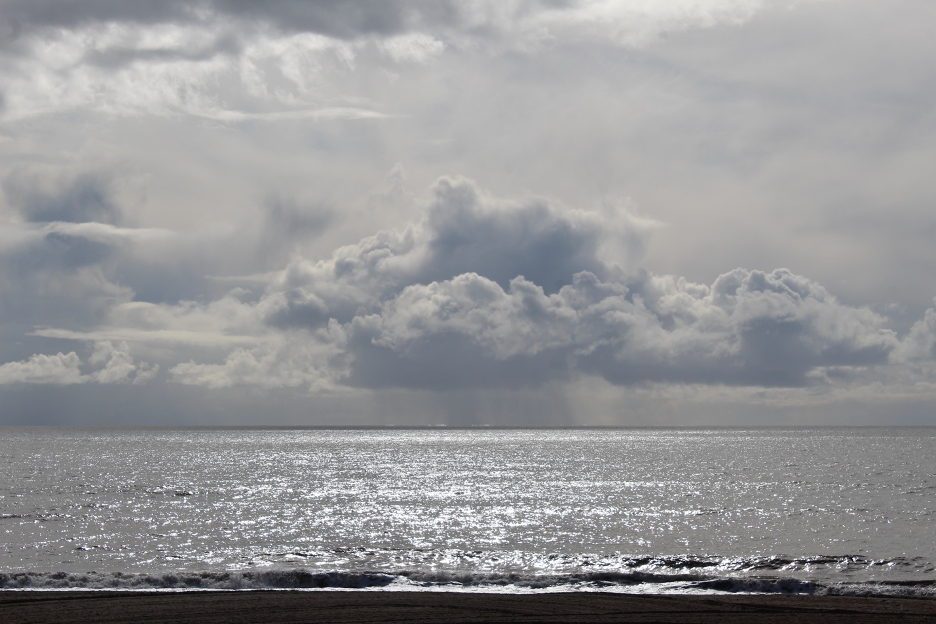
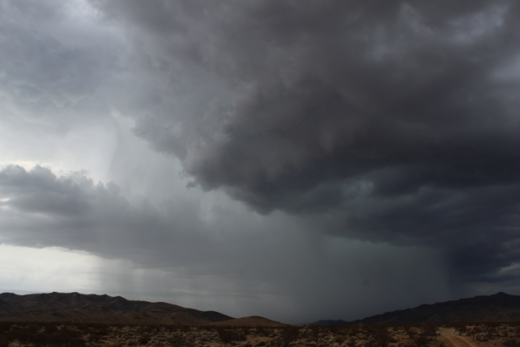
As the center of the low-pressure system passes nearby on November 18, moist air becomes unstable. Towering cumulus clouds boil into the cold air aloft, where large ice crystals grow until they fall toward the surface and melt, forming heavy showers in the distance. Higher layers of ice crystal cirrus clouds shield our view of the blue sky.
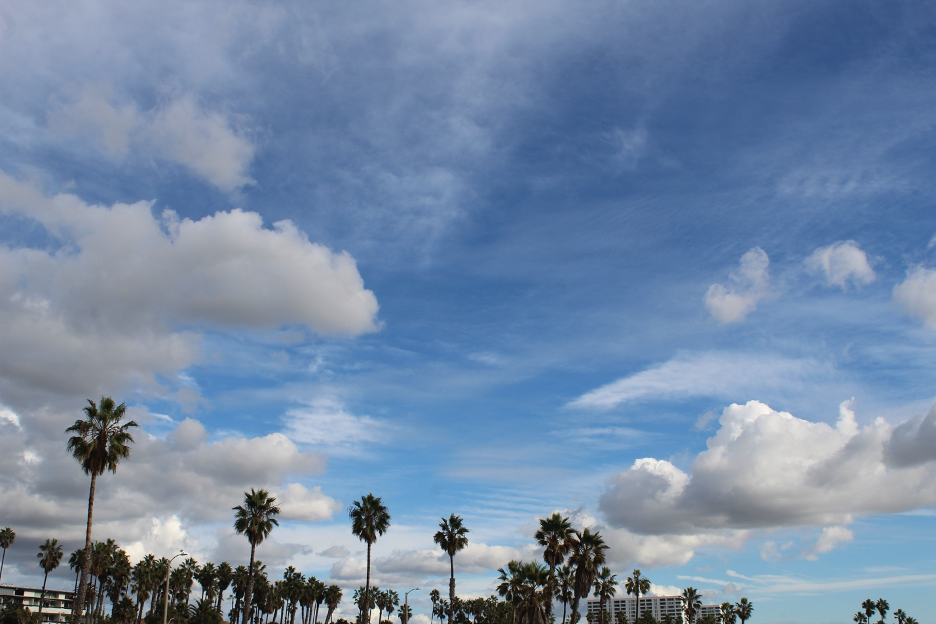
A break in the clouds appeared between turbulent impulses as the center of low pressure moved inland on November 21. Note the thin cirrus clouds drifting above flat-bottomed-puffy-topped cumulus. Look carefully to see the ripples (ribs) that have formed in horizontal waves perpendicular to the upper-level winds that are flowing toward the low.
Ocean Current Mysteries
Augmenting the improbability of these captivating whodunnits, all this early-season atmospheric chaos was raining down during the start of a weak La Niña year, when cooling water currents in the tropical East Pacific might be expected to result in more stable air and a relatively dry SoCal rainy season. Here’s more proof that the El Niño/La Niña Oscillations we research as ENSO cycles (such as in previous stories on this website) and their effects have NOT been as dependable or predictable during this century compared to late last century. We are reminded that we are observing and researching targets that are constantly moving and evolving.
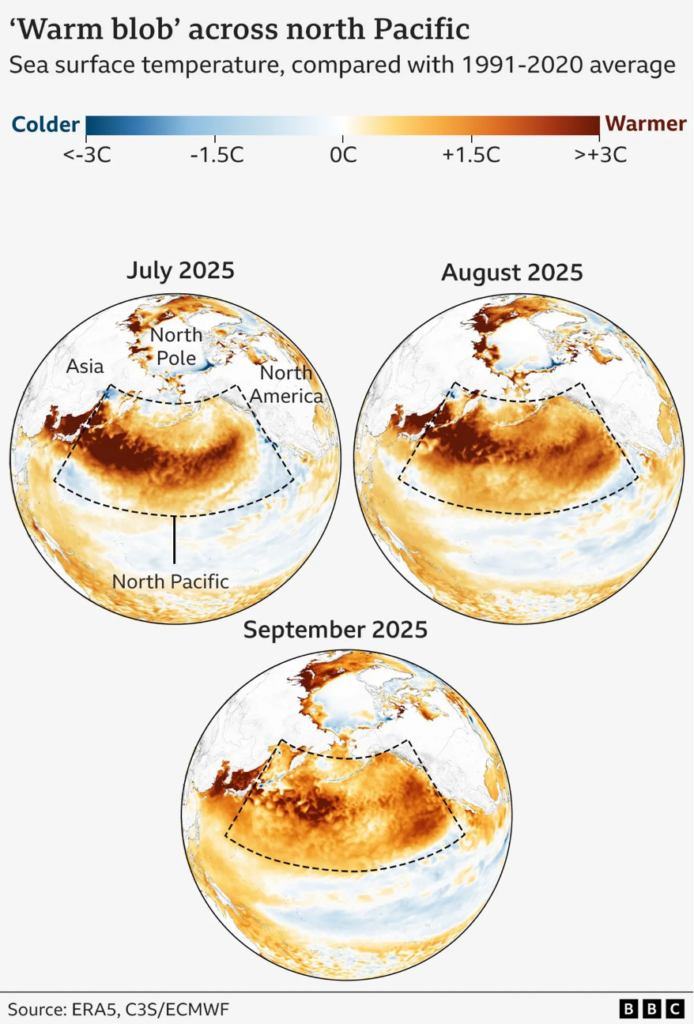
A possible less-understood culprit for the October-December 2025 SoCal wetness could have been the now infamous North Pacific “blob” that peaked in September and circulated through the end of the year. This giant marine heat wave (which has reappeared in some form during recent years) expanded to 5,000 miles across the Northern Pacific Ocean until sea surface temperatures maxed out at a record 68°F (20°C). In addition to ongoing climate change, research suggests that recent decreases in air pollution (particularly sulfur dioxide) from cleaner shipping and Chinese sources have helped to clear Pacific air masses of reflective aerosols, allowing more direct solar radiation to heat ocean surfaces. Regardless, such a mysterious warm blob throws another complicating variable into our understanding of ocean-atmosphere interactions that could be responsible for these historic anomalies.
This graphic from the BBC shows the development of “The Blob” as warmer-than-average sea surface temperatures extended across the Pacific Ocean in 2025.
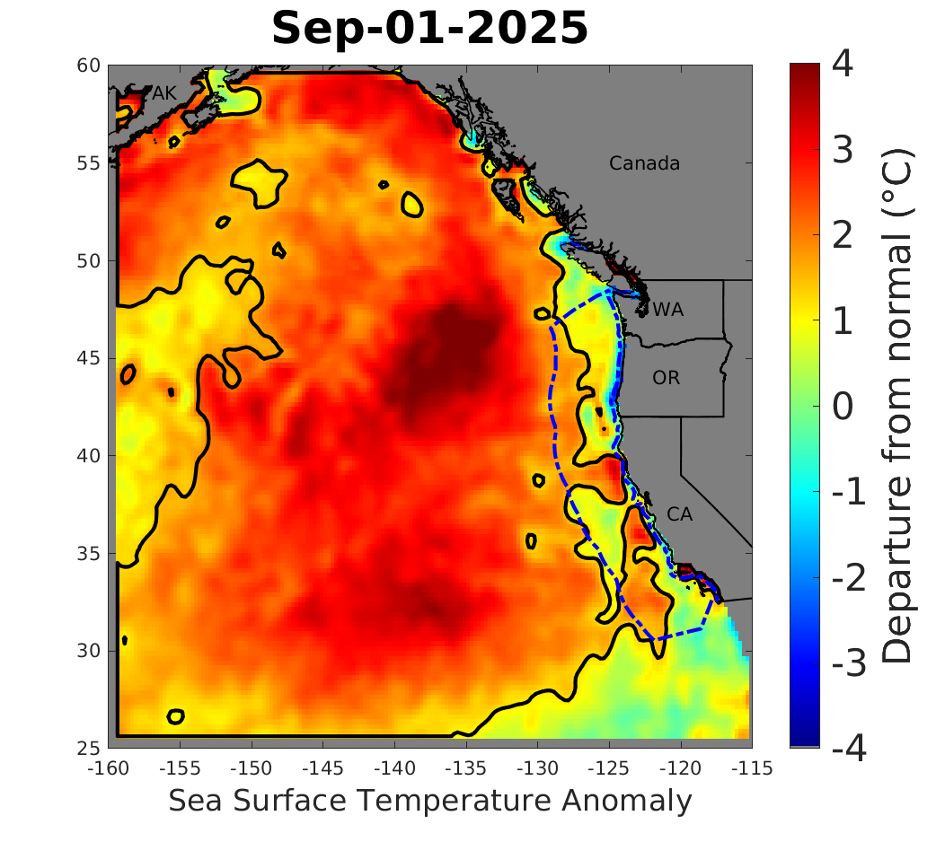
“The Blob” expanded to its greatest extent during September. Source: NOAA.
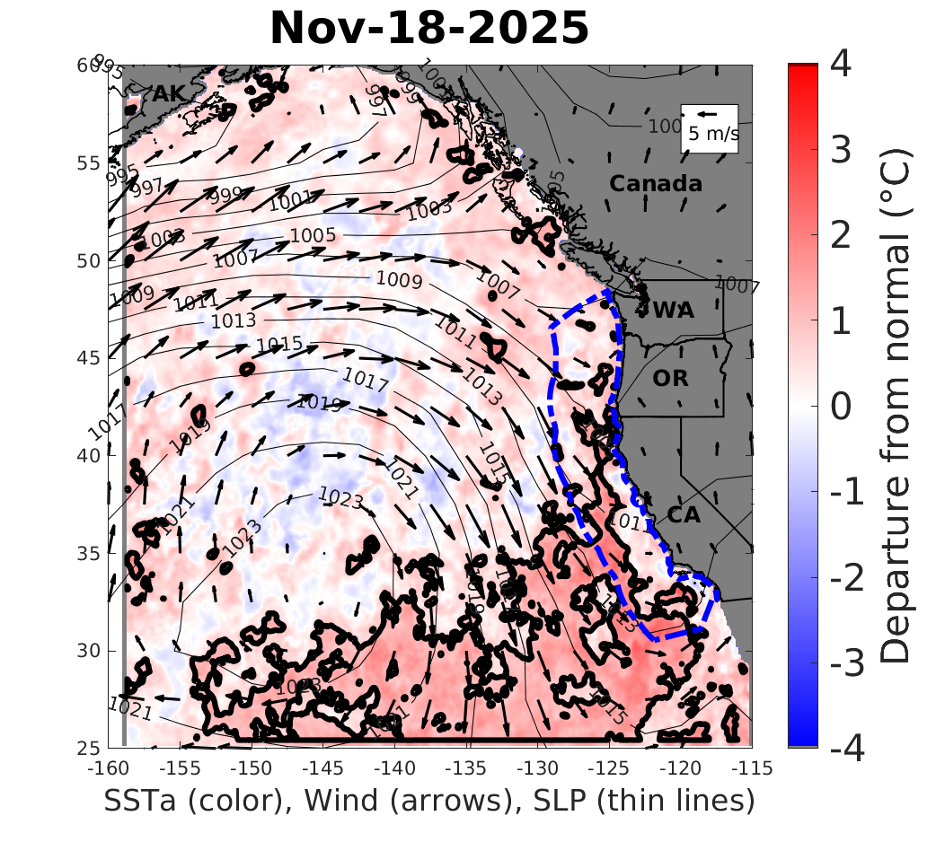
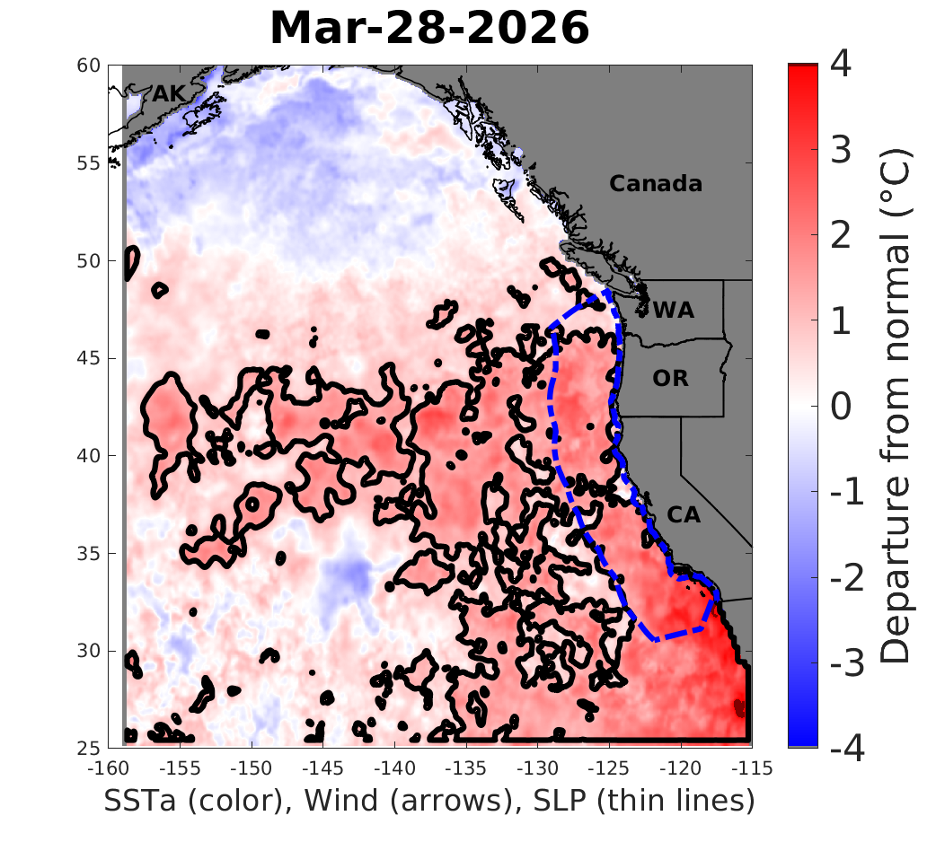
“The Blob” had circulated farther south by November. “Daily sea surface temperature anomalies (SSTa) in the California Current ecosystem. Color represents SSTa, with the thick black line encircling regions which are in “heatwave status”; arrows represent wind speed and direction; thin lines represent atmospheric pressure at sea level. Blue dashed line represents the US West Coast exclusive economic zone (EEZ).” Source: NOAA.
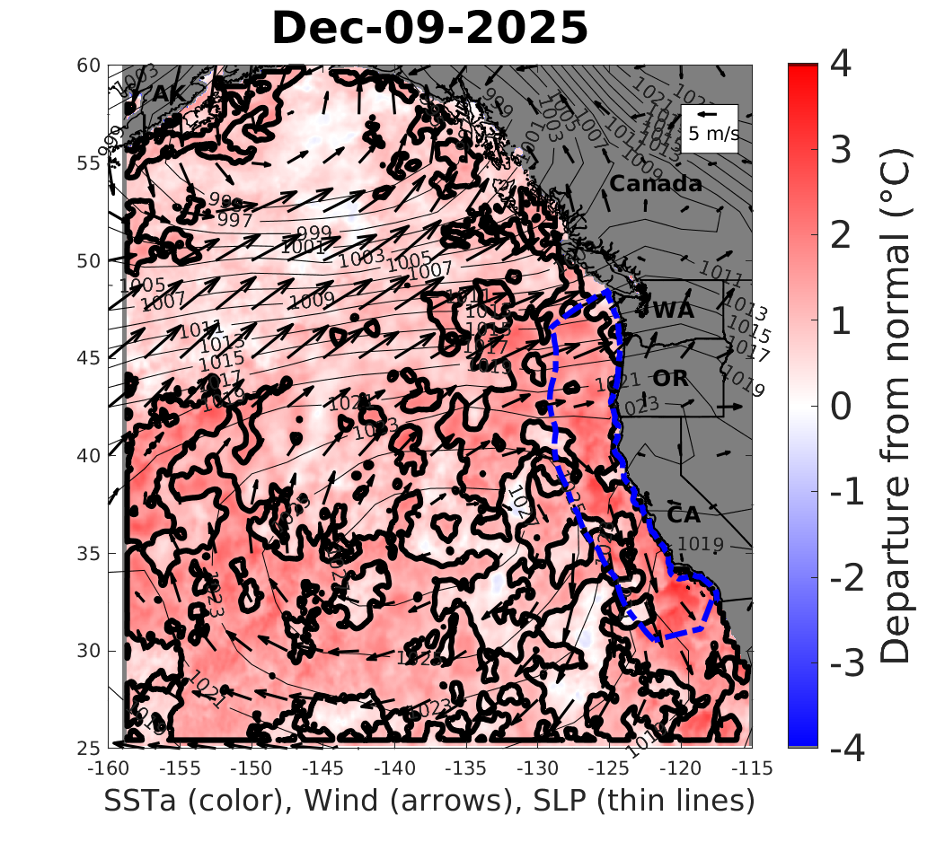
Large patches of warmer-than-average ocean water temperatures were still being measured in December, though this was supposed to be a La Niña Year. “Daily sea surface temperature anomalies (SSTa) in the California Current ecosystem. Color represents SSTa, with the thick black line encircling regions which are in “heatwave status”; arrows represent wind speed and direction; thin lines represent atmospheric pressure at sea level. Blue dashed line represents the US West Coast exclusive economic zone (EEZ).” Source: NOAA.
Episode Two: High Pressure Heat Versus Cold Fog
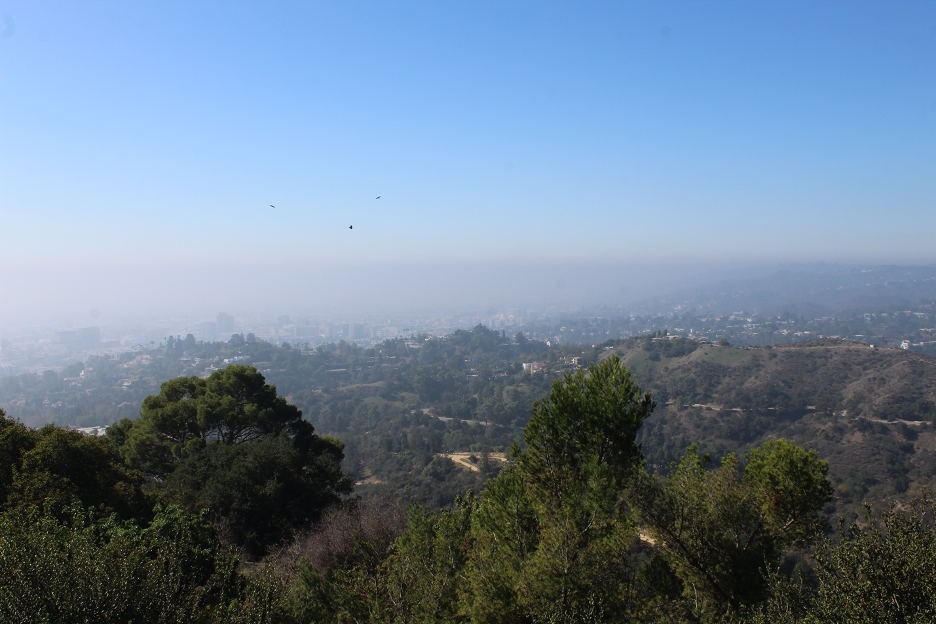
As if to keep us on our toes and our eyes on the skes, nature abruptly and dramatically flipped the switch again after mid-November. Massive high-pressure systems took control, building and oscillating off the Southern California coast and over the Southwest States into Mexico. The strength and extent of these tall, heavy domes of stacked air challenged seasonal records and eventually dominated the entire state. As air descended out of the monstrous fair-weather storm blockers, clear and dry became the latest curious forecast fads across most of the state, lasting an entire month through mid-December, a period which normally marks the annual start to our seasonal rains. The November air columns started out cool, but days of dry offshore flow and compressional heating pushed temperatures into the 80s along the SoCal coast and into the upper 80s in the inland valleys right into mid-December. Weather stations in the Coast Ranges (such as in the Santa Cruz Mountains) and Sierra Nevada foothills recorded high temperatures well into the 70s in the clear, dry, sinking air. Adding an additional layer of complexity, another conspicuous exception developed and stubbornly held out as the antithesis to the warm and dry: historic valley fog episodes.
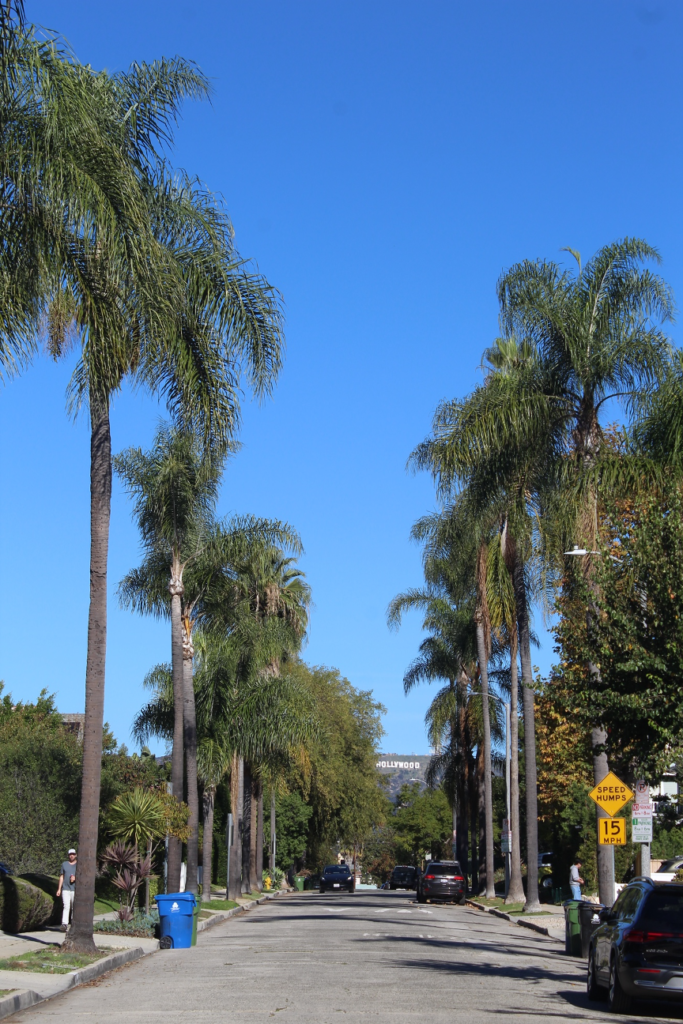
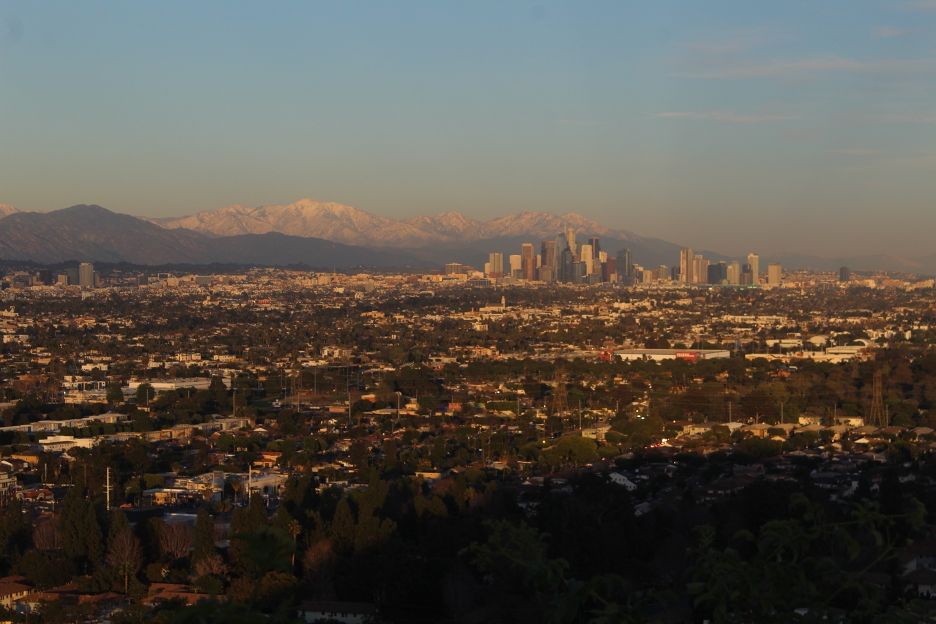
The Hollywood sign appears in the distance through the palms during an offshore breeze that produced quintessential clear skies and temperatures in the 70s in Southern California on Dec 4, 2025. Further warming under domes of high pressure would push December temperatures into the 80s during this month-long break between soaking stormy periods.
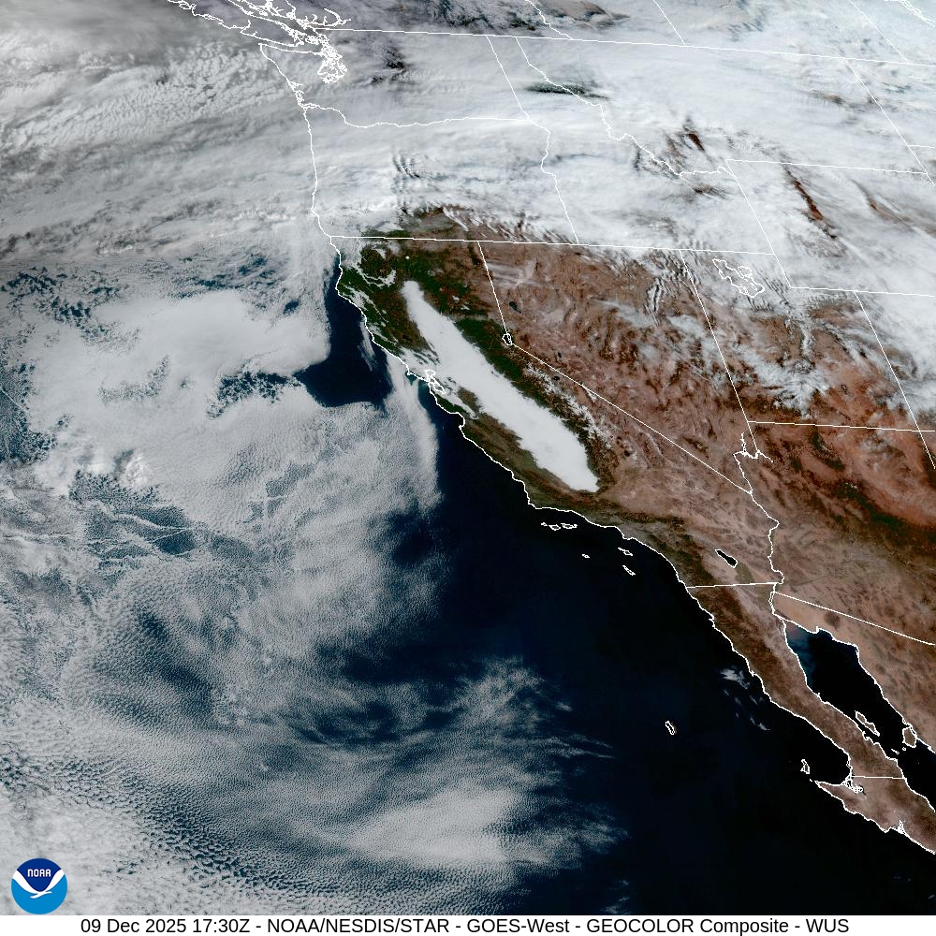
As air descends under a persistent dome of high pressure over California, it is heated by compression. This satellite image from December 9, 2025 shows clear skies and dry air, especially over Southern California, where temperatures would soar into the 80s. But the Central Valley is enveloped and trapped in a shallow layer of cold low clouds and fog that have spread into Bay Area and some other northern California lowlands. Riding up and over the high pressure, an energetic atmospheric river continues to flood the Pacific Northwest. Source: NOAA/National Weather Service.
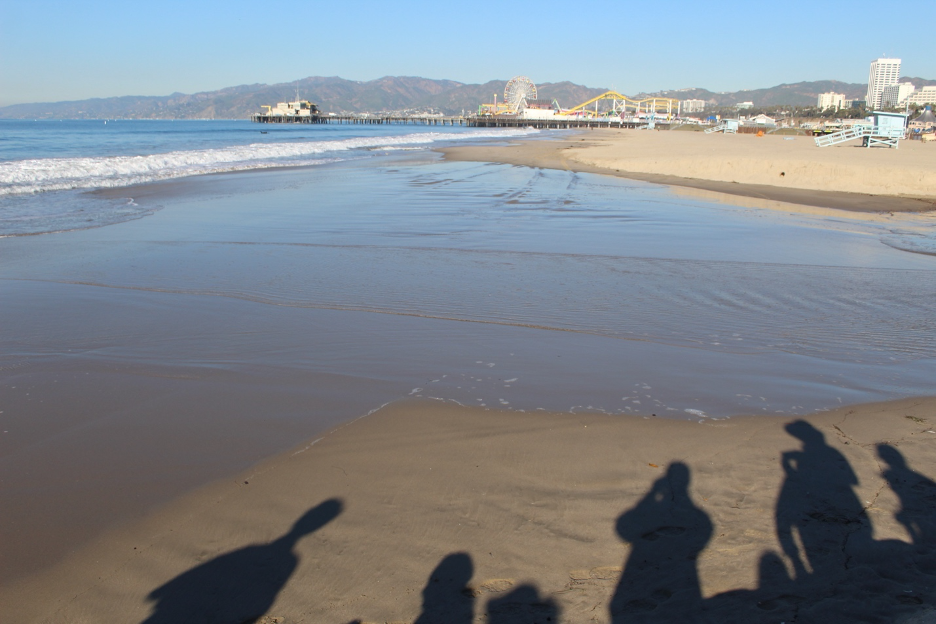
Another perfectly clear dry day greeted Southern California participants on December 6, as they celebrated the annual King Tides event. Californians up and down the coast from Oregon to the Mexican border took photographs at the exact time of highest tides and shared them online with scientists. But these astronomical high tides contrasted with a stable weather period when high pressure, small waves, and gentle offshore winds kept the tides at bay. In contrast, when the highest tides returned in early January, they joined forces with low pressure, onshore winds, and a storm surge that caused historic flooding, particularly along Bay Area shorelines.
Epic Fog Traps
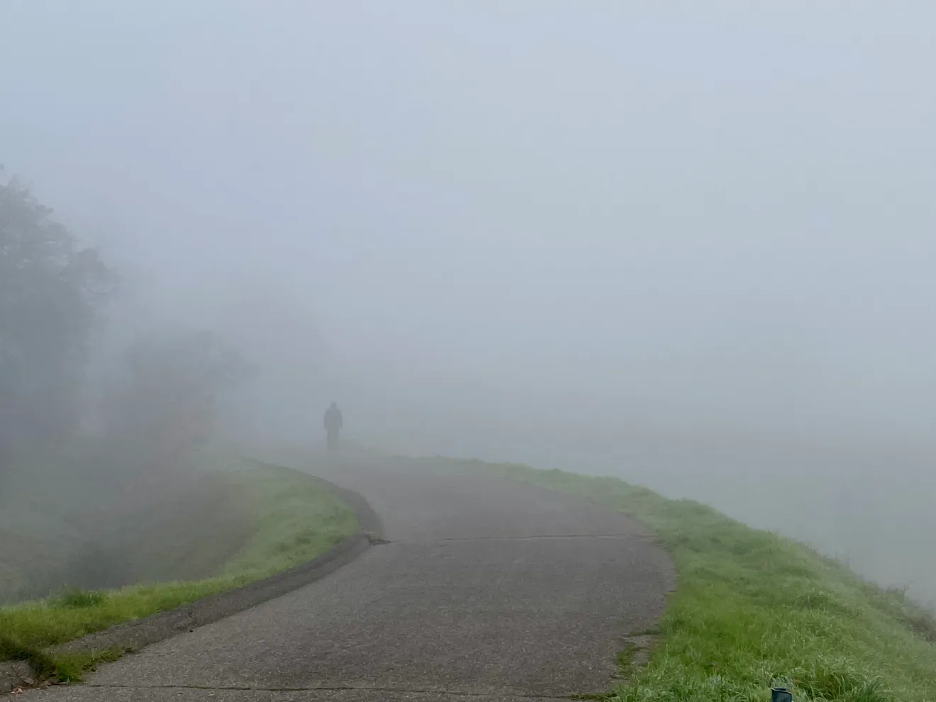
The same powerful high pressure that squeezed Southwest air columns toward the surface for a month also capped a shallow layer of cold air that settled and pooled in Northern and Central California inland valleys like dense water in a vast bathtub. I’ve written on this website and in my latest California Sky Watcher book about how our Great Central Valley is the perfect winter laboratory to make valley fog (AKA as tule fog or radiation fog), which forms in place as cold, dense, heavy air often settles down to the lowest flatlands and becomes trapped for 400 miles from Redding to Bakersfield. In this latest classic episode, the valley floor had been moistened by those earlier October/November rain events; then, the air just sat down there below the inversion with little or no circulation as leftover heat radiated out, gradually cooling the air toward its dewpoint. Once the late-night air chilled to near 100% relative humidity, the moist haze turned to cold fog. Now, we have a saturated pool of air trapped in the confines of our natural oval-shaped beaker, with the Coast Ranges on one side and the Sierra Nevada Mountains on the other.
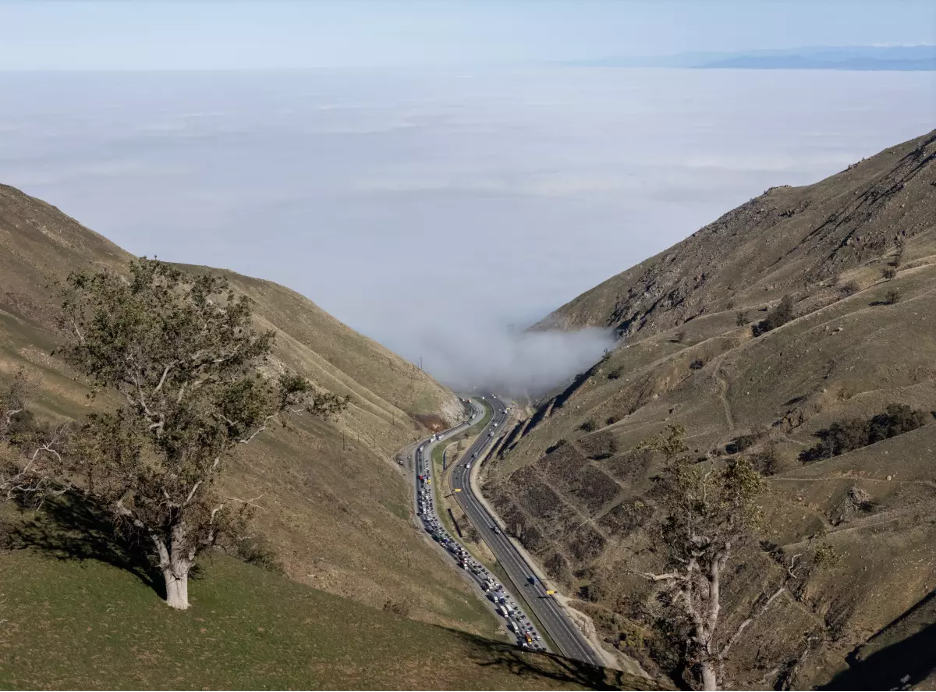
It’s clear up here in the warm, dry air. But we are looking down into winter’s classic tule (valley) fog that has settled in the San Joaquin Valley. Travelers are often stunned by sudden temperature changes of up to 30 °F when crossing the boundary between unlimited views above the inversion and near zero visibilities in the cold gray mist below. Photo by Myung J. Chun of the LA Times.
With such short daylight hours and low sun angles, weak sunlight struggled to boost temperatures above dewpoints, allowing the winter fog to further thicken during long nights until it didn’t even “burn off” during the daytime. This tule fog enshrouded the valley from late November well into mid-December, 2025. It became the star of conversations, news headlines, and memes as the cold and gray bled west through the Carquinez Strait to invade the Bay Area. As valley temperatures stalled in the 40s, Bay Area residents shivered through consecutive hazy and foggy days that could barely warm into the 50s. The dull creepy mist also condensed in other inland valleys through Central and Northern California, from wine country, to the Trinity, Klamath, and Eel River Basins. Such a remarkable and historic prolonged exaggeration of the annual valley fog doldrums was capable of depressing the most upbeat Pollyanna to beg for mercy in the form of some clear-sky relief.
Whether you call it valley, radiation, or tule fog, it all looked the same for 400 miles from Redding past Bakersfield. This is at Redding’s Sundial Bridge on December 11, 2025, near the northern extent of the weeks-long atmospheric quagmire. Temperatures hovered in the 40s F through what seemed to be endless stagnant foggy days and nights. Source: Mike Chapman, Redding Record Searchlight.
To be or not to be Fog
Though we call it “fog”, this particular weeks-long episode often formed as low stratus cloud ceilings a few hundred feet above the ground. Visibilities near the ground (and below the thicker hovering blanket) were often measured at around a mile or so, decreasing at night and slightly improving again each afternoon. Just above the inversion, at around 2,000 feet above sea level, temperatures warmed well into the 70s each day thanks to dry, sinking air and unlimited visibilities. Some mountain and foothill communities could only look down through their pristine ether toward the distant layers of thick silver cotton below. In contrast, that same descending air often scoured out any inversions trying to form in SoCal. When the high pressure strengthened overhead, the Southland enjoyed a string of iconic warm and crystal-clear December days. When the resilient high weakened or drifted a bit, a shallow marine layer was enabled to spread night and morning fog into coastal valleys. During those days, most California coastal and valley communities were mired below stagnant inversions that forced air quality management districts to issue alerts and enforce no burn days: no chestnuts roasting on open fires to belch smoke that quickly gets trapped below shallow choking anvils.
When high pressure weakened or moved just a bit, it allowed a shallow marine layer to creep in under the inversion. The result was infamous late night and early morning fog along the coast, otherwise mostly sunny afternoons. This is also when air quality management districts often declared no burn days, as air pollutants were trapped in the shallow atmospheric soup. When high pressure strengthened again and nudged inland, offshore breezes would wipe out the haze and leave brilliant clear days. The dark hill in the foreground was scorched in last year’s Palisades firestorm. Note how vulnerable the burn-scar slopes were to the downpours that would follow: welcome to mud and debris flow country.
Pollution and Fog Partnerships
Recent research shows that the frequency of cold valley fog events in California was increasing each decade into the 1980s, most likely because of increasing air pollution. Droplets of water are more likely to condense around certain particulate matter, known as cloud condensation nuclei. As emissions from fuels combustion and farm operations increased, fog episodes became thicker and more frequent. After the 1980s, as air pollution controls took effect and emissions decreased, so has the frequency of dense fog. Indeed, there is an exact correlation between NOx pollution (nitrogen oxides) content in valley air and fog density and frequency, measured both from the ground and satellite imagery. This could explain why the more recent thickest “fog” actually formed a few hundred feet above sea level, leaving the higher fringes of the valley shrouded while residents at lower elevations were looking up toward the grayest low blanket. Gradual climate change could also be playing a role when today’s warming surface temperatures remain just a degree or two above valley dew points.
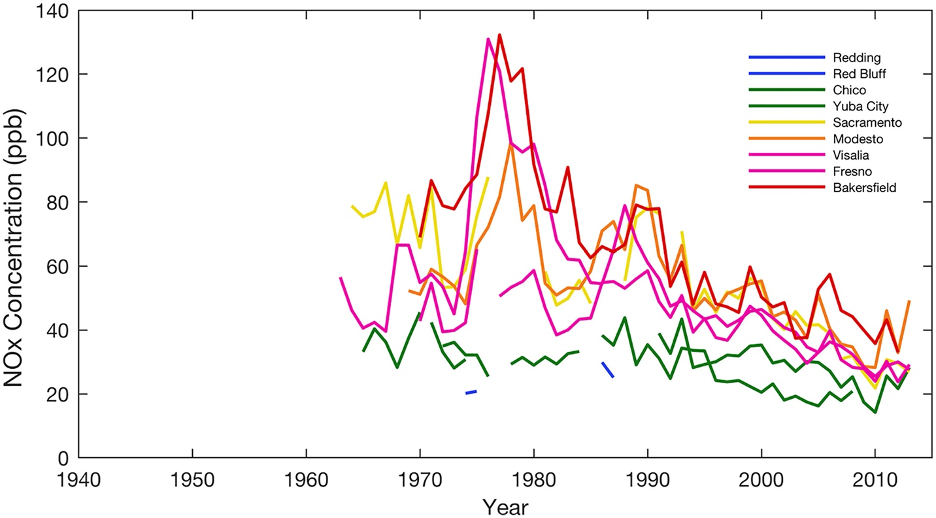
Winter NOx concentrations in the Central Valley show decreasing air pollution since the 1970s. “Time series of wintertime (November–March) NOx concentration from 1962 to 2014 from the CARB archive. Color coding represents change in 1° of latitude, beginning at 40°N with cool colors representing northern cities and warm colors representing southern. ppb = parts per billion.” Source: JGR atmospheres:https://doi.org/10.1029/2018JD029419
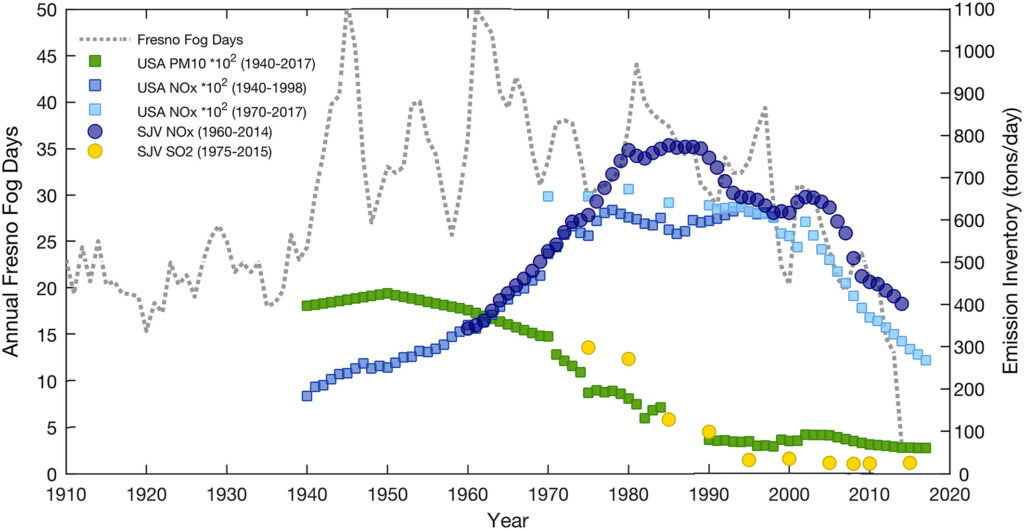
This graph shows how pollution AND fog episodes in Fresno have been decreasing since the 1970s. “Time series of smoothed Fresno fog days from National Oceanic and Atmospheric Administration records (gray dotted line) plotted with national (square) and local (circle) emission inventories in tons per day. NOx inventories represented by shades of blue points: two national NOx inventories, ranging from 1940 to 1998 and 1970 to 2017, and one local San Joaquin Valley NOx inventory from 1960 to 2014. National PM10 estimates from 1940 to 2017 represented by green squares. Local SO2 estimates from 1975 to 2015 represented by yellow circles.” Source: JGR atmospheres:https://doi.org/10.1029/2018JD029419
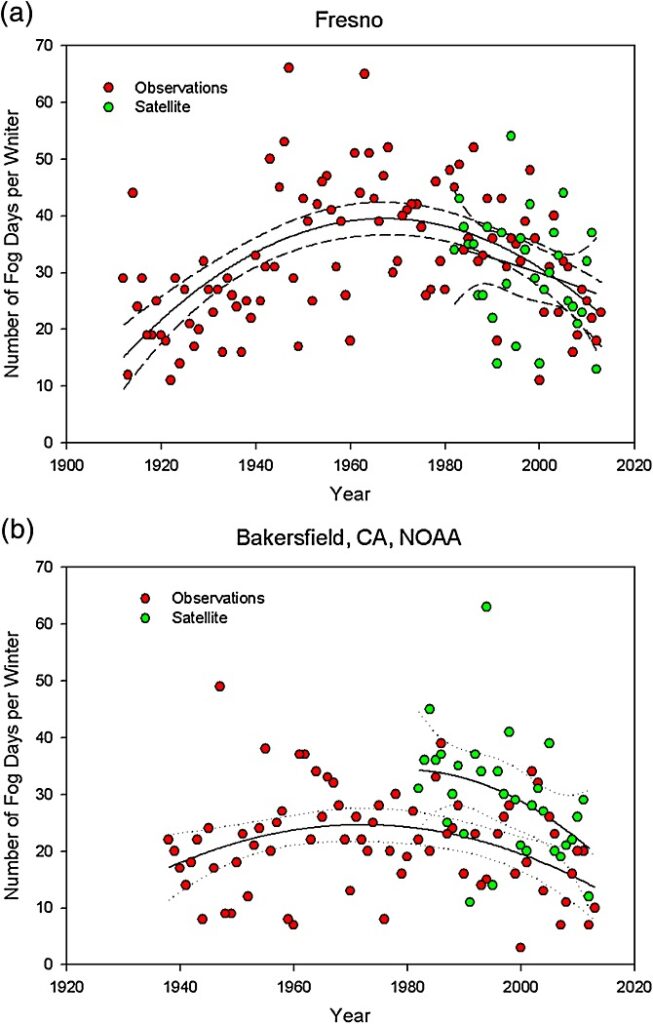
Whether measured from the ground or space, the number of winter fog days in Bakersfield and Fresno have been decreasing since the 1970s. (Valley fog is absent during the warm season.) “Validation of the satellite-derived measures of fog with ground observations from the (a) Fresno and (b) Bakersfield Airports.” Source: AGU Geophysical Research Letters: https://doi.org/10.1002/2014GL060018
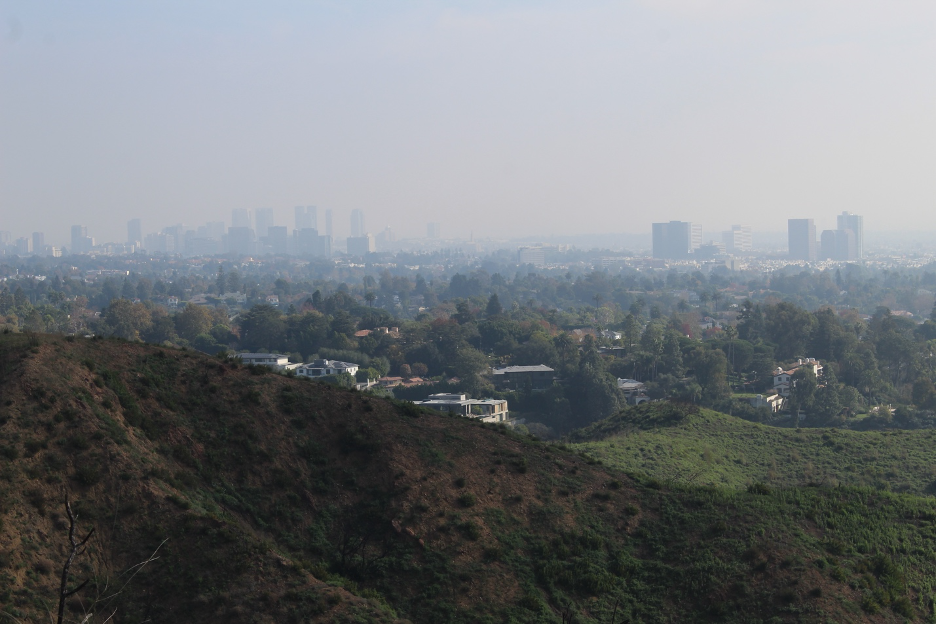
Is this fog or smog trapped below the early November inversion? It’s both. Since water droplets often condense around abundant particulate matter (PM) that act as cloud condensation nuclei, haze and fog are more likely to form when the air is polluted and near its dewpoint.
Essential Fog
These might seem like foggy details, but they are important for a number of reasons, far beyond casting our brooding moods; here are two. First, transportation is often crippled by dense valley fog. There is a long history of deadly California accidents caused by low visibilities, followed by scenes of multiple mangled vehicles once the mysterious murk finally begins to clear. Surviving commuters have been caught in hours of gridlock on shrouded highways and narrow serpentine detour routes. Air traffic is often diverted and delayed when even the most experienced pilots with highly sophisticated cockpit instruments are challenged while attempting to take off or land through such dense curtains of potential aviation disasters. Second, the foggy winter chill deposits some moisture and may shield valley fruit and nut trees from direct sunlight during dormant periods of rest, which eventually increases annual production of these multi-billion-dollar agricultural products. (Before native plant communities were plowed, grazed, and developed into history, winter fog played an essential role in nurturing vast valley prairies that some coined California’s Kansas.)
Tule fog’s malaise is finally broken up when restraining high pressure eases or moves away and when turbulent instability sweeps in from the Pacific, allowing wind currents to scour down to valley floors. Regardless, this latest misty atmospheric quagmire kept millions of acres and millions of Californians from the Central Valley to the Bay Area enveloped throughout a remarkable string of consecutive clammy days and nights with temperatures stuck in the 40s F.
Winter’s frigid tule fog condenses in place and seems to sit there. This photo was taken along the Sacramento River Trail on Dec 13, 2025 by Jenny Espino and appeared in Redding’s Record Searchlight. By then, countless news stories had covered the incessant widespread fog event.
Episode Three: Catastrophic Floods and Frigid East Coast Connections
We can also recognize how our resilient high-pressure blocker was part of a larger pattern that dominated weather across the continent. As air descended out of our massive high, its winds were turned to the right by the Coriolis force, creating those familiar clockwise pinwheel circulations common to all high-pressure systems that often span thousands of miles in the Northern Hemisphere. These gyrating winds curved toward big, cold low-pressure systems spinning counterclockwise in the Gulf of Alaska. Strong pressure gradients and powerful air streams grew along narrow battlefronts between the highs and lows to drive abundant moisture and embedded disturbances flowing across the Pacific within atmospheric firehoses; a parade of rainmakers were directed north, up and over California’s tall stacks of fair weather and into the stormy Pacific Northwest.
The resulting archetypal atmospheric rivers (ARs) had sources so distant and farther south of Hawaii that Mango Express replaced the more familiar Pineapple Express monikers. The prolonged invasions of unusually warm moist air strengthened to attack the Pacific Northwest. Snow levels were so high, almost all the precipitation fell as torrential mountain rain that had to runoff somewhere. Rivers surged over their banks in December until record stream gauge heights sent catastrophic flooding across landscapes and into neighborhoods from north of Portland into Canada.
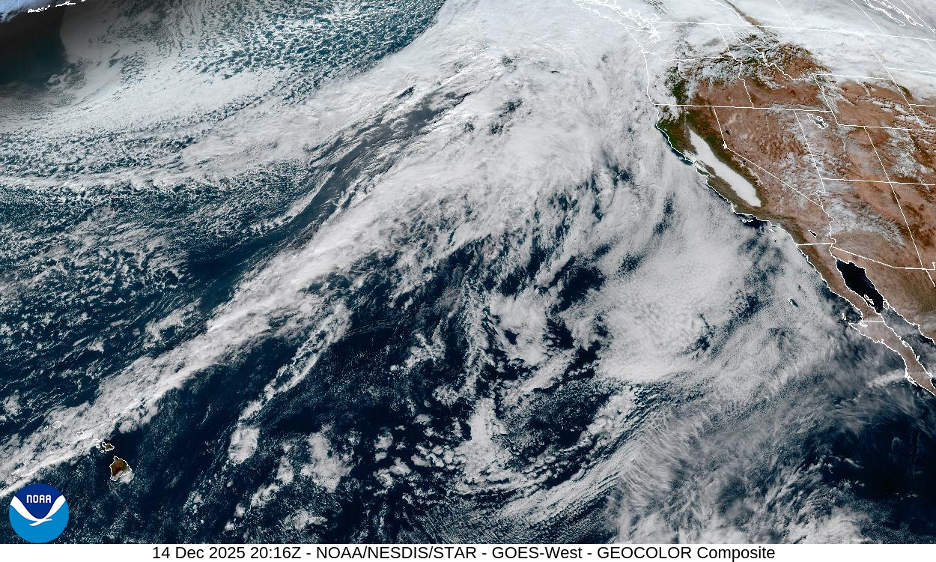
On this day, storms were still riding north over the ridge of high pressure in the Southwest, where daily high temperature records were being broken. But the big ridge would gradually shift east after December 14, 2025, allowing the AR to begin sliding south, so that Pacific Northwest streams and rivers might recover from catastrophic flooding. Source: NOAA/National Weather Service.
Amplified Waves Make West Coast-East Coast Connections
How is this connected to the December artic blasts that dropped clippers of snow, ice, and wind storms across the upper Midwest until temperatures plunged below zero F and wind chills could freeze flesh within a few minutes? Once that same stream of air arched up and over our West Coast high pressure ridge, it came diving down its opposite (east) side and into the middle of the continent. This downstream trough opened the door for arctic air to race directly out of Canada and all the way to the East Coast, proving how all of these pattern shifts and winds are connected. And these high-amplitude waves in the upper-level winds are just what computer models have warned us about. As the Arctic has warmed faster than most other locations on our planet, temperature gradients and pressure gradients between warmer air to the south and cool air to the north are decreasing. The jet stream that forms between these contrasting air masses tends to slow down and form large meanders (Rossby waves) of upper-level troughs and ridges that get stuck in place and that’s exactly what happened through mid-December. Two more powerful connections in one paragraph!
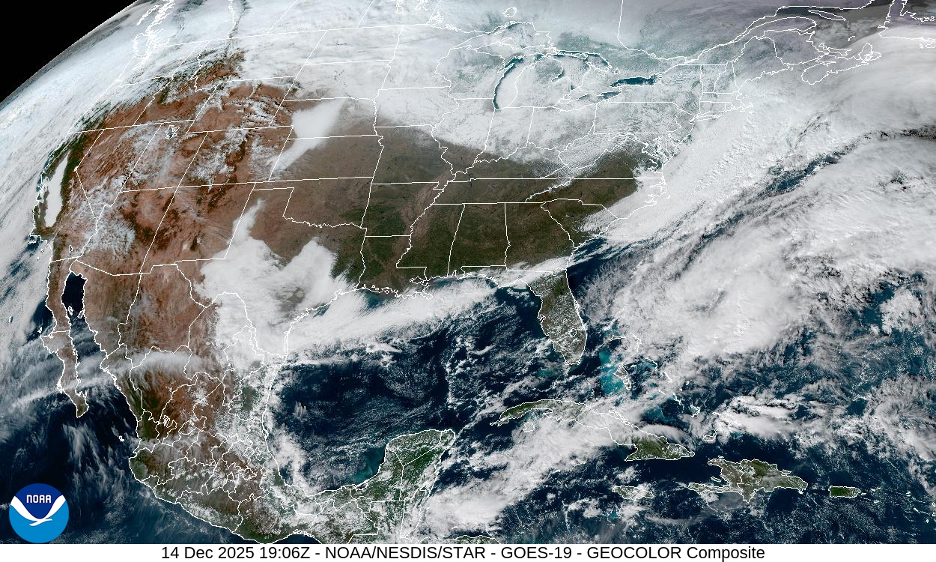
Here is the satellite view looking down on the eastern US on the same day as the last image (December 14). Follow the storm track as it rides north up and over the western ridge and then slides down south, bringing frigid air into the stormy Midwest and East Coast. Source: NOAA/National Weather Service.
This 500mb chart from December 14 shows how pressure patterns had been steering upper-level winds and ARs into the Pacific Northwest up and over a high-pressure ridge dominating the Southwest. Farther east, frigid winds from Canada were plunging south, down the backside of the ridge and toward the big stormy low-pressure trough drifting across the Midwest. Weather conditions from west to east may have seemed worlds apart, but they were interconnected by these high-amplitude meandering waves. Source: National Centers for Environmental Prediction, Weather Prediction Center.
Episode Four: Atmospheric Rivers Bring More Winds of Change
Later in December, yet another major weather pattern whiplash changed everything again. The stubborn Southwest high-pressure system finally began weakening and drifting away, allowing that historic atmospheric river to gradually, mile by mile, sag south as pressures dropped. As it shifted south, the AR whipped back and forth, targeting most of California through the holiday season. To keep your attention and prove how these winter AR storms mean business in Northern California’s high country, consider this NWS forecast on December 23, 2025 for Mount Shasta:
“Snow. The snow could be heavy at times. Low around 13. Wind chill values as low as -13. Windy, with a south wind 85 to 95 mph increasing to 100 to 110 mph after midnight. Winds could gust as high as 115 mph. Chance of precipitation is 100%. New snow accumulation of 41 to 47 inches possible.”
Unfortunately, snow levels remained very high especially early during most of these AR onslaughts, adding snowpacks only to the highest elevations, often above resort levels. A low-pressure trough forming off the coast finally bent the AR into a more southwest-northeast oriented arc to circulate copious amounts of rain and high-elevation snow into the state. As air pressure continued to drop offshore, fears of a “bomb cyclone” event grew, while pulses of damaging winds, thunderstorms, and other severe weather swung across California’s Central and North coast during the holidays.
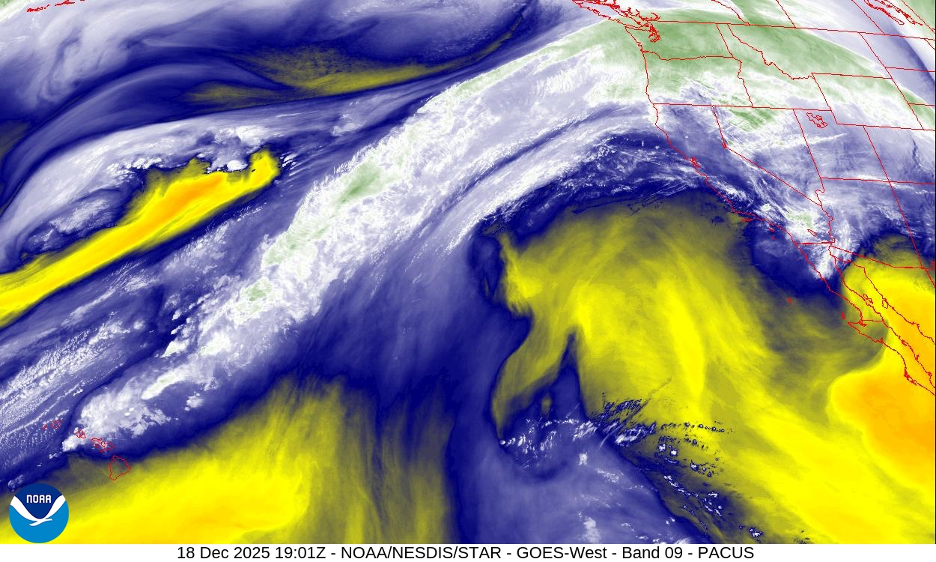
In this Dec. 18 water vapor satellite image, you can see signs that high pressure over California and off the coast is beginning to yield to moisture and clouds drifting ahead of the atmospheric river that will drop into California. Source: NOAA/National Weather Service.
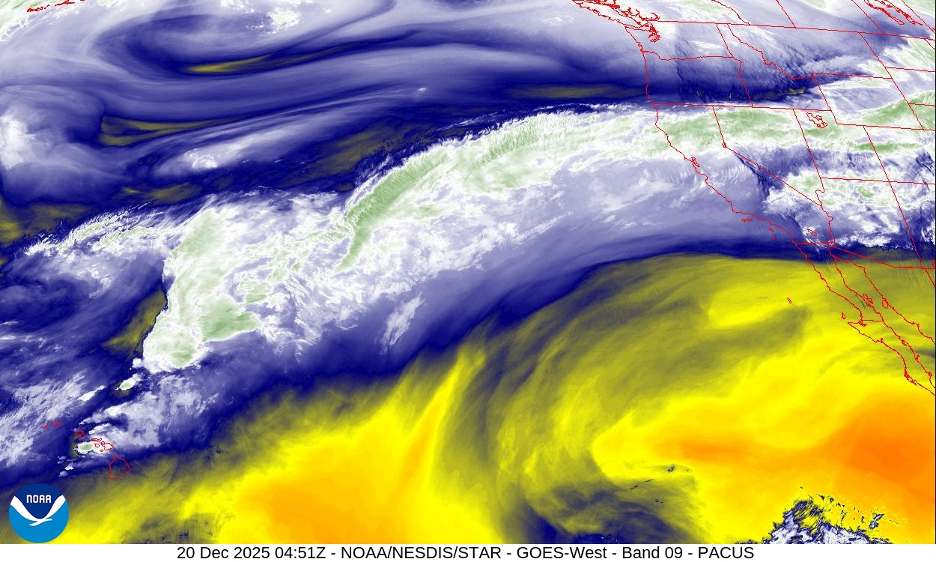
By December 20, the AR firehose has gradually shifted south over Northern California, where drenching warm rains would dominate the weather for days. Source: NOAA/National Weather Service.
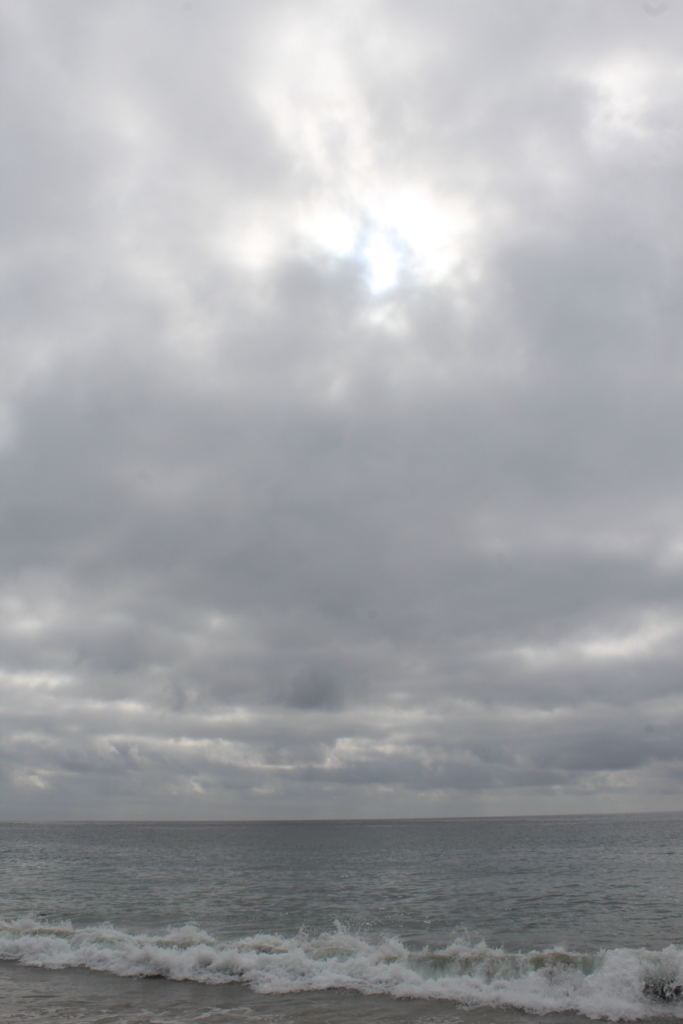
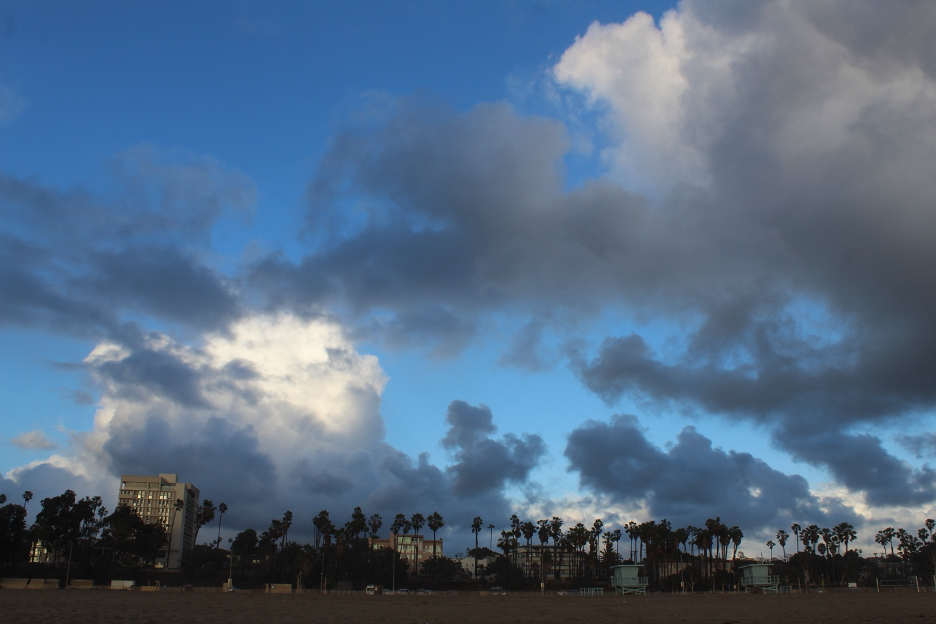
By December 20, persistent high pressure finally weakened and drifted east, allowing the marine layer to thicken. Onshore flow carried warm, moist air masses off the Pacific and encouraged increasing clouds (such as these stratocumulus) to drift inland. As pressures dropped, we could anticipate the arrival of the latest atmospheric river as far south as Southern California.
By December 21, a developing low-pressure trough off the coast tilted the AR into a southwest-northeast alignment. This circulation would usher in exceptionally moist, warm air masses from south of Hawaii into California. Resulting turbulence would finally break the back of the valley fog and set the stage for a two-week long series of drenching storms and ARs that would flood south all the way into Southern California. Source: NOAA/National Weather Service.
And as the bullseye finally migrated into Southern California, this AR was following recent patterns, behaving much like computer models have also warned: as global temperatures increase, warmer water can evaporate into warmer air that has the capacity to hold more water vapor. These trends are loading ARs with moisture and energy since the air can hold about 7% more water vapor for every 1°C increase in temperature (about 4% more water vapor for each 1°F). Recent single AR events have produced more than a foot of rain as they get lifted over higher terrain. In this holiday episode, such orographic effects dumped more than a foot of water into rain gauges from north of Santa Barbara along the Transverse Ranges into the San Gabriel Mountains. Where ARs had stalled over them, some weather stations had already received their average annual rainfall totals even before the two normally wettest months (January and February) of the season. As expected, flooding and debris flows belched out of the mountains, particularly below recent burn scars. The resort communities of Wrightwood and Lytle Creek in the San Gabriel Mountains earned most of the media attention for mudflow destruction (see links to videos following these essays). With a few exceptions, many of these fitful storms lost much of their punch while trying to slip south toward San Diego County, bringing mostly lighter and beneficial precipitation there.
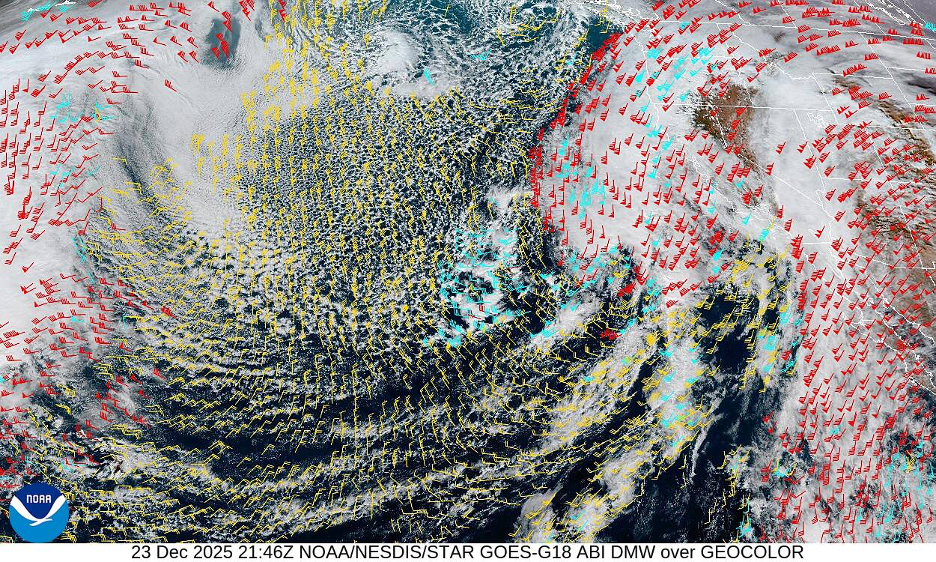
By December 23, a major winter storm and its AR was flooding most of California. Wind barbs and flags were added to this satellite view to show the direction of winds at low to high altitudes. Note the influx of warm, moist air from the south and into California on the right side of the middle latitude cyclone. Far out in the Pacific, on the right side (behind) of the cyclone, you can see cold air flowing down from the north. This pattern would be repeated for nearly two weeks as a series of exceptionally wet Pacific storms moved through. Source: NOAA/National Weather Service.
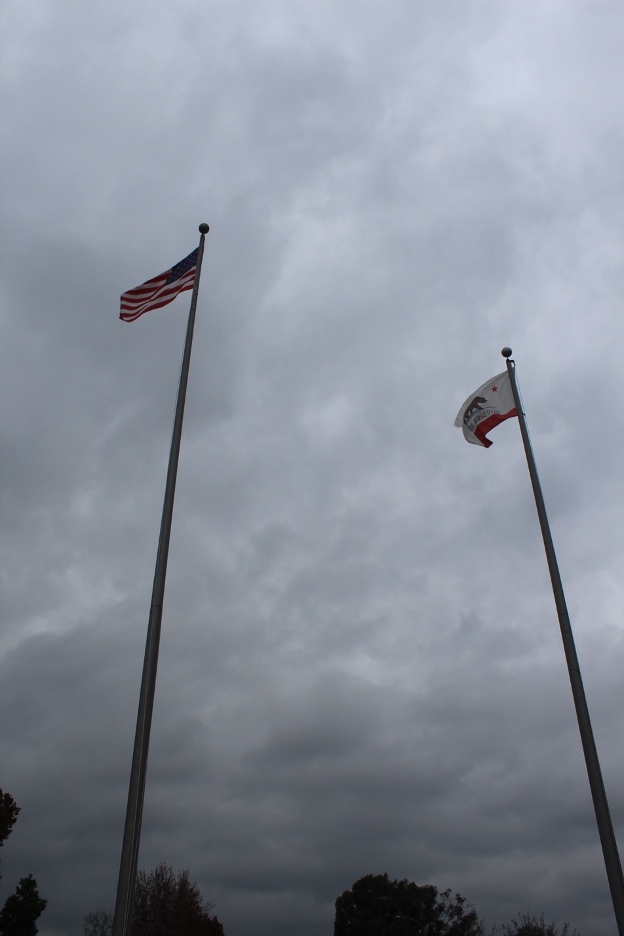
During the same day (Dec. 23) as in the previous satellite image, flags flapped, trees bowed, and thick clouds streamed in the stiff south-to-north winds blowing into and ahead of a deep low-pressure system that was approaching from the northwest. We could sense the tropical nature of the warm, moist air as it circulated off the Pacific and overhead. Heavy rains quickly followed. These archetypal pre-storm surface conditions were repeated as several additional storms approached and swept through the state into the New Year. (But forecasts can get tricky if a cyclone approaches from the southwest, instigating backing winds to blow more from the east and off the dry land. In those cases it takes some time for precipitation to moisten lower-altitude air masses enough so that the rain won’t evaporate before reaching the surface.)
Wind direction and speed are shown (flags and barbs) with these satellite images that span about five hours during December 24. Source: NOAA/National Weather Service.
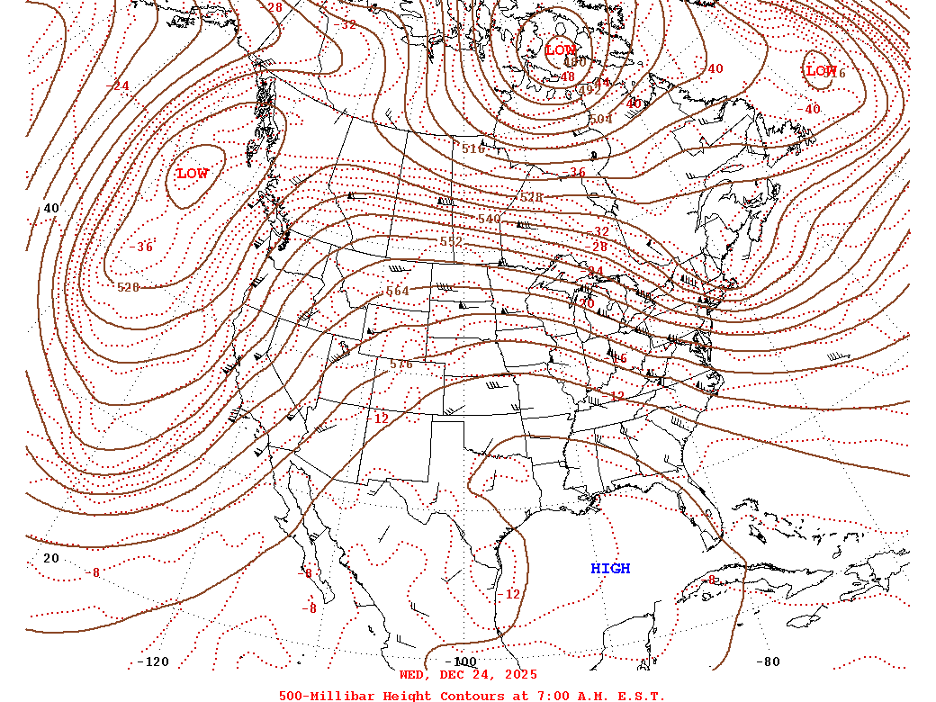
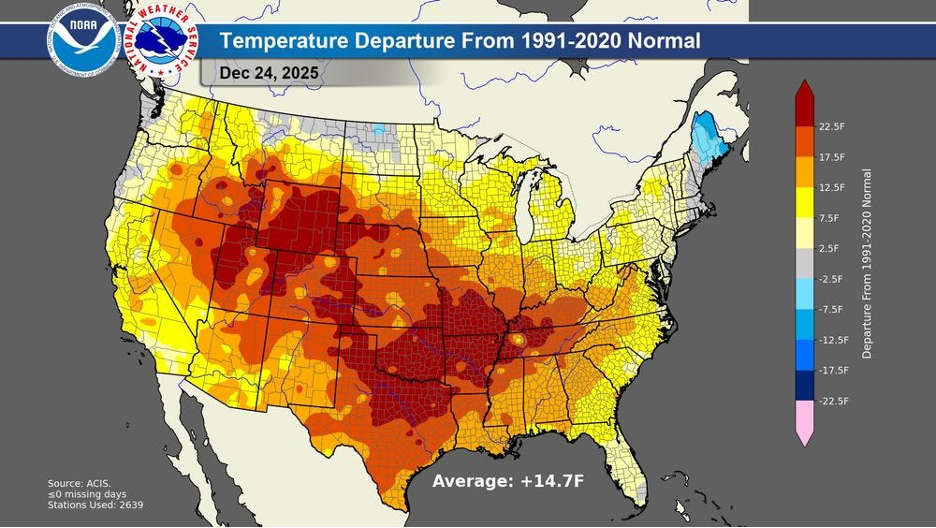
Reiterating the power of atmospheric connections (again), upper-level winds dipping around the low-pressure trough that directed firehoses to blast California through the Christmas season were forced to turn back north over a massive high-pressure ridge dominating the central US. Air descending out of this monster dome of high pressure set countless records for both the hottest high and highest low temperatures ever recorded during the holiday season, from Arizona, Utah, and New Mexico, across the Rocky Mountains, through the Plains and Midwest and into the southern US. Temperatures peaked at 20-35°F above the average in many of these regions (high temperatures in and around Oklahoma City made it past 80°F) while some Californians were getting washed out.
On December 24, a deep low-pressure trough dominated off the West Coast, directing wet storms into California. But connected meanders in the upper-level waves and jet stream curved up and north of the dominant high-pressure ridge anchored over the middle of the country. Record holiday-season temperatures soared more than 20 °F above average throughout the West, South, and Midwest US. Source: National Centers for Environmental Prediction, Weather Prediction Center.
It would be difficult to overstate the difference between the start of last year’s rainy season and this 2025-2026 season, especially in Southern California. (The official water season begins on October 1 each year.) The parade of holiday storms continued across California through the first few days of January, raining on the Rose Parade for the first time in 20 years and cancelling celebrations into the New Year’s Weekend. Contrast this year’s drought-breaking and eventual deadly inundations with virtually no rain by this time last year and the deadly fires that followed. On January 1 alone, more than one inch of rain fell from Oxnard to Long Beach, setting new records for the date. By early January, 2026, numerous locations from north of Orange County to the Central Coast Ranges had already equaled or exceeded their average annual rainfall totals, just as the two traditionally wettest months of the year were to begin. Some stations (such as in Santa Barbara County) experienced their wettest start just after last year’s record driest start to any rainy season. On the first days of January this year, freshwater runoff coincided with another astronomical King Tides event, causing historic shoreline flooding (such as around the Bay Area), when the tides combined with low pressure, onshore winds, and storm surges. You can see why we can only guess what surprises to expect in the long run, so stay tuned.
Episode Five: January into early February, 2026: Yet More Historic Weather Whiplash
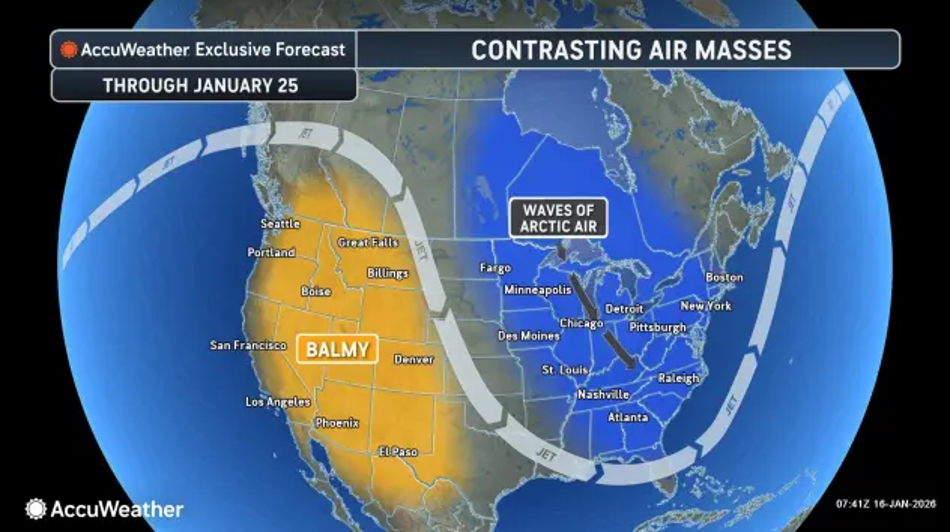
January 2026 brought yet another meteorological shift that will go down in the record books. As if to mimic another movie sequel, a giant high-pressure system formed over California; but this time, it eventually elongated all the way up past the Canadian border. The big storm blocker kept California dry for weeks during the middle of the rainy season and left some Pacific Northwest locations (such as Seattle) with their longest period without precipitation during any January in history. And in what has become a familiar twist of weather pattern whiplash fate, upper-level winds that curved north of the West Coast and into Canada then made drastic U-turns to plunge toward the middle of the continent. These same winds raced south from the Arctic, driving temperatures below zero Fahrenheit into the Midwest, spreading historic freezing ice and snow storms across the continent to the East Coast, prompting deep freeze news stories that lasted through much of January. It was yet another example of how West Coast-East Coast antithetic extremes become connected by high-amplitude upper-level waves that seem to get stuck in place. The following images illustrate some of January’s weather dramas.
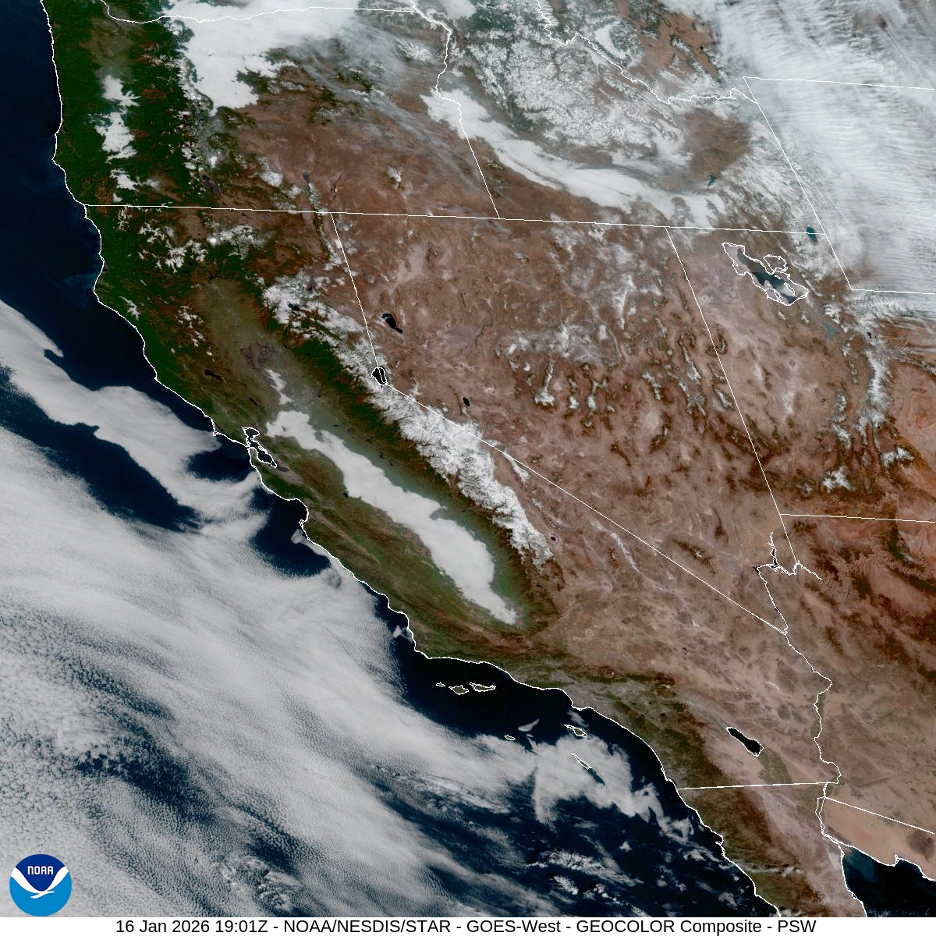
A prolonged dry pattern has been established for nearly two weeks by January 16, 2026. Sierra Nevada snowpacks were melting away and stubborn Central Valley fog is struggling under the midday sun. High pressure is in charge here. Afternoon temperatures would soar into the 80s for several January days throughout Southern California. Source: NOAA/National Weather Service.
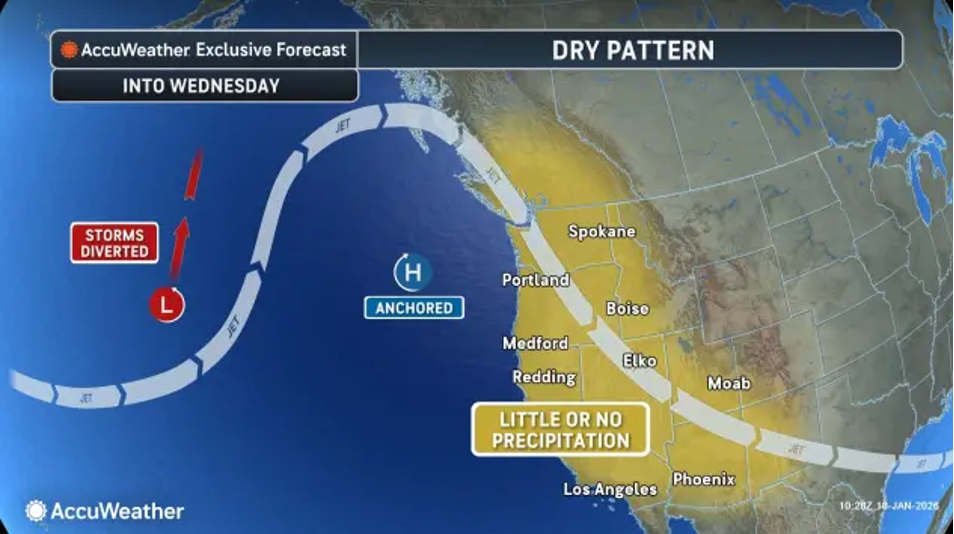
This dry ridging pattern dominated over the West Coast through most of January, 2026. Source: AccuWeather.Winds over our West Coast fair-weather ridge meandered to form a deep trough over the middle and eastern portions of the continent. Northerly winds ushered in waves of bitter cold, ice, and snow storms there through late January, 2026. Source: AccuWeather.
Winter’s middle latitude cyclones churned over the Pacific, but were blocked by our massive resilient West Coast high-pressure systems. Except for extensive valley fog, sunny and mild ruled the forecasts from Mexico to Canada throughout most of January, 2026. Source: NOAA/National Weather Service.
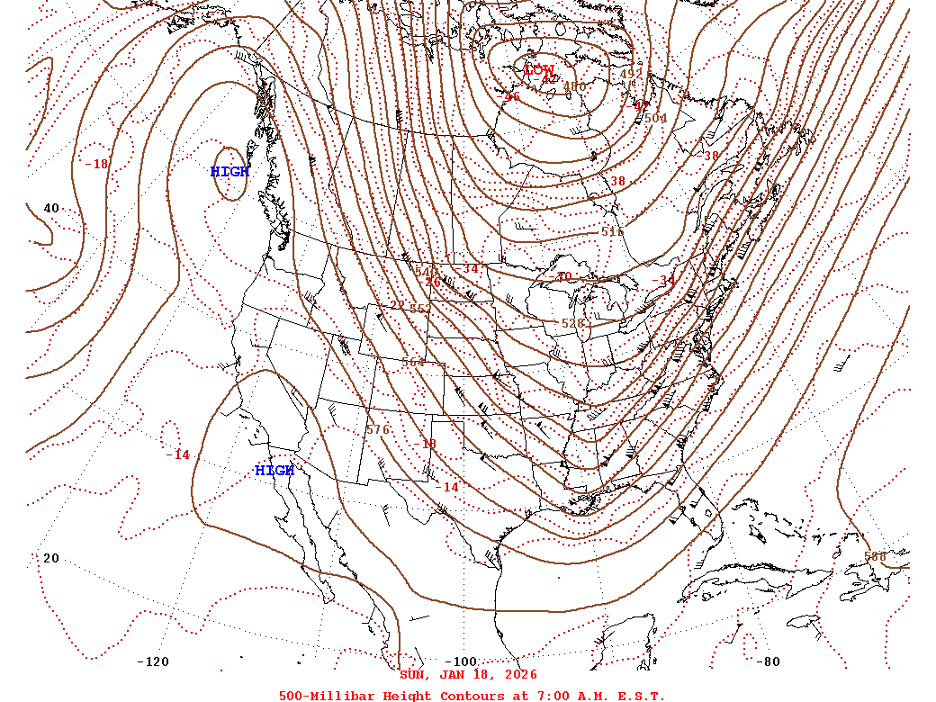
This 500mb chart rom January 18 shows the amplified West Coast fair-weather ridge adjacent to the historic cold arctic trough to the east. Follow the contours and winds that flow out of the Arctic, then deep into the southern US. Similar upper-level patterns remained nearly stuck in place through the end of January. Source: National Centers for Environmental Prediction, Weather Prediction Center.
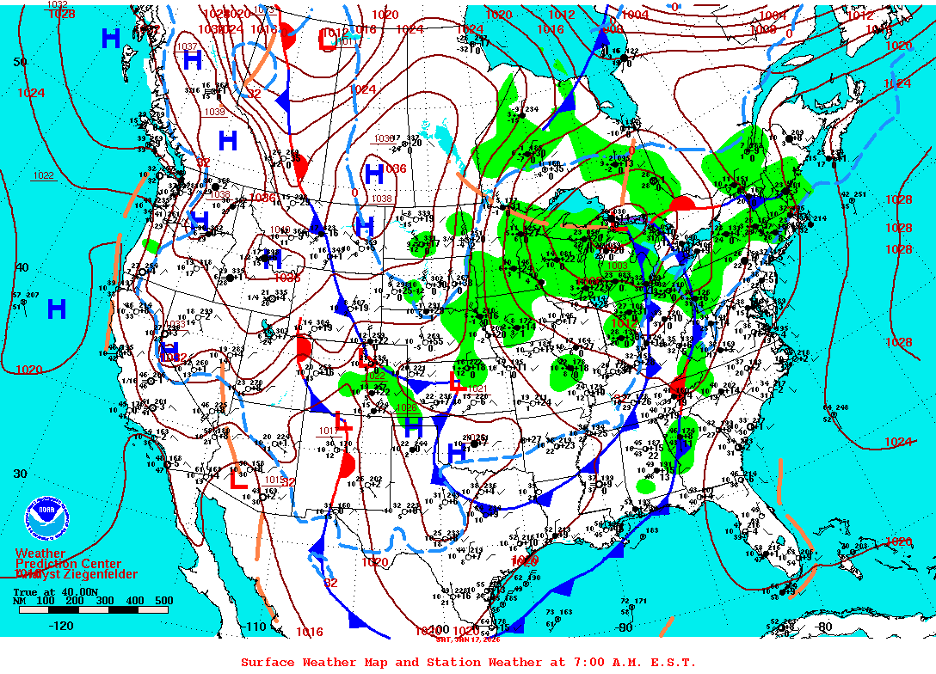
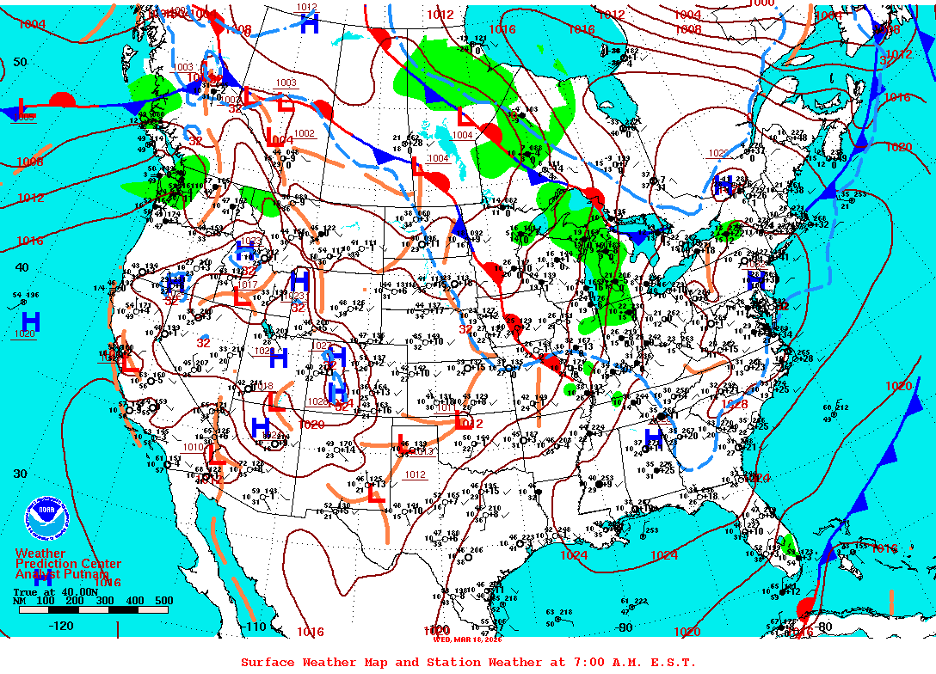
This surface map from mid-January displays blocking high pressure in the West and the series of turbulent cold fronts that swept frigid air masses down into the Midwest and East. Source: National Centers for Environmental Prediction, Weather Prediction Center.
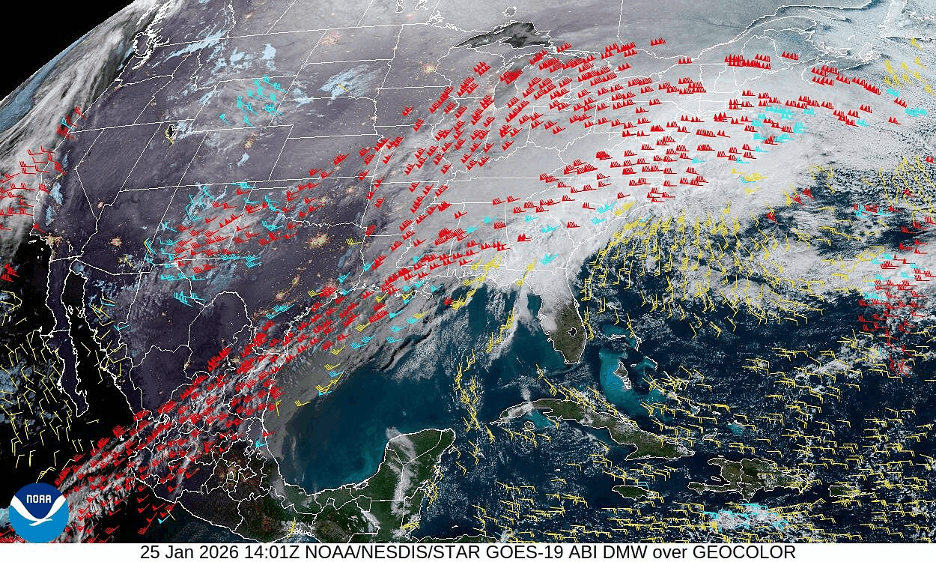
Follow the moisture as it streams from southwest to northeast (lower left to upper right) from the Pacific Ocean, across Mexico and the Gulf of Mexico, and then all the way to the northeastern US. The warm, moist air is gliding up and over an extensive frontal boundary as it encounters extremely cold air racing south from Canada. This monumental airmass battleground grew deadlier as it wreaked havoc across about two-thirds of the US. By contrast, note the clear patches signaling fair weather beneath our blocking West Coast high-pressure ridge. Source: NOAA/National Weather Service.
Wind barbs and flags help us see where the bitter cold arctic air is pushing south against the warm, moist airstreams. Source: NOAA/National Weather Service.
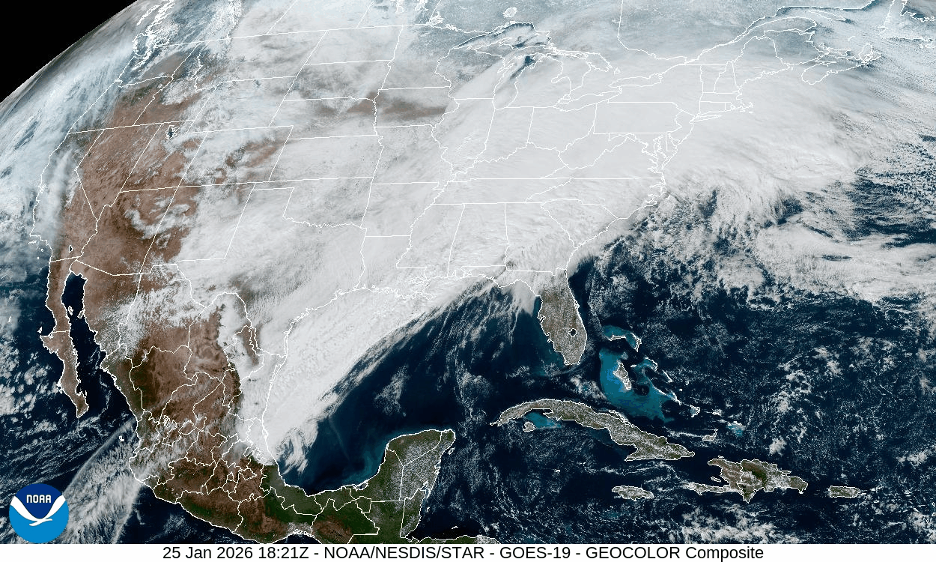
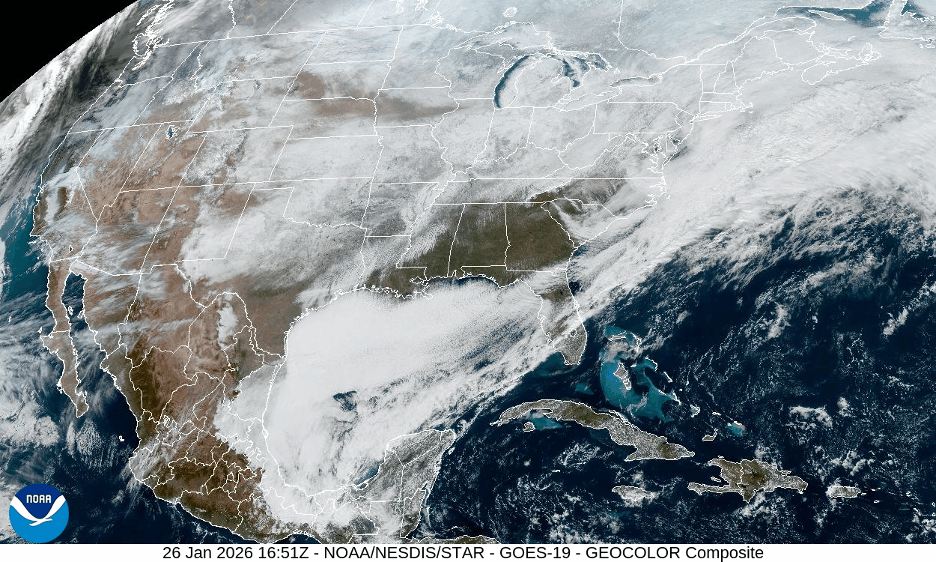
By the next day (January 26), the monster front slumped south across southern Florida and the southern Gulf of Mexico and into the Atlantic Ocean. Extensive areas of reflective snow and ice were left behind across the Midwest and Northeast, along with a prolonged period of bitter cold temperatures all the way into Florida and the Gulf States. Note how most of California and the Southwest remain under fair weather high pressure, except for the patches of typical winter valley fog. Source: NOAA/National Weather Service.
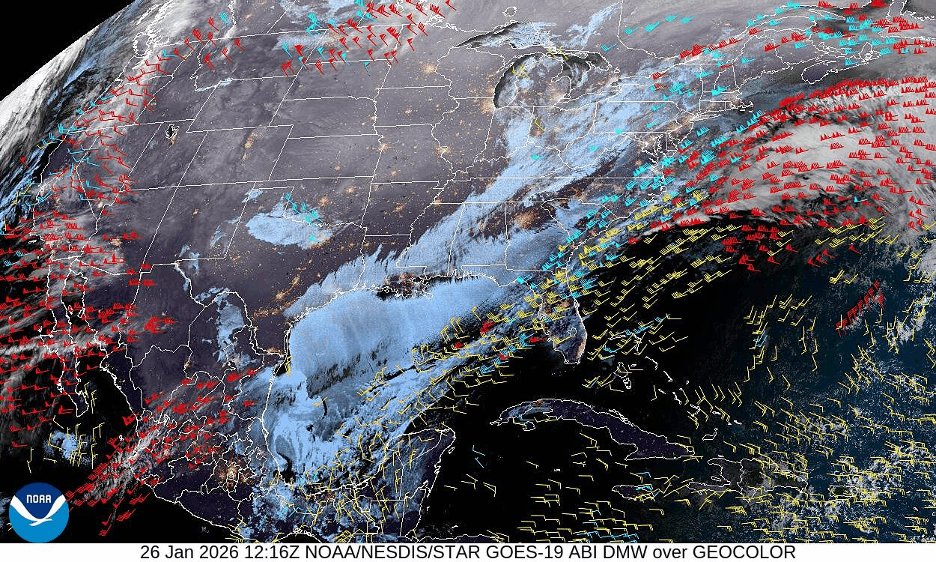
The frontal boundary is well defined by the wind flags and barbs, illustrating the abrupt shift from warm, moist southern air to extremely cold, dry air racing out of the north to cover the continent. Meanwhile, chamber of commerce mostly fair weather anchors over the Southwest to dominate into late January, where temperatures would creep back into the 80s in Southern California. Source: NOAA/National Weather Service.
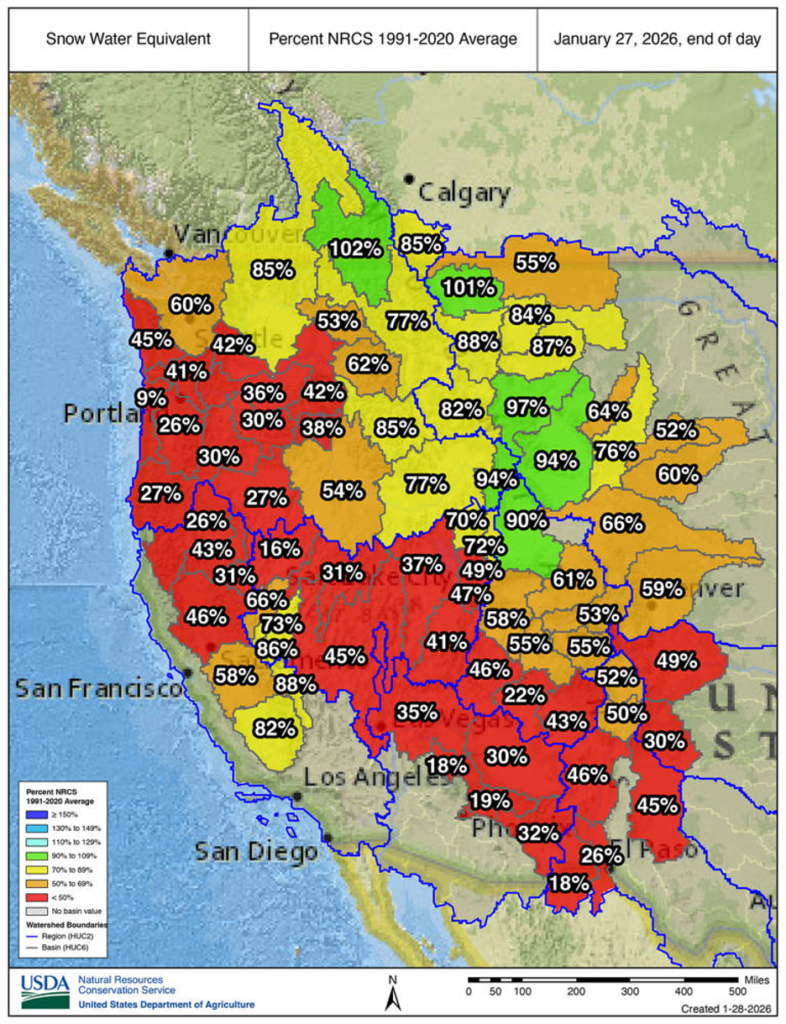
By late January, snowpacks had dwindled to alarming low depths across western US ranges.
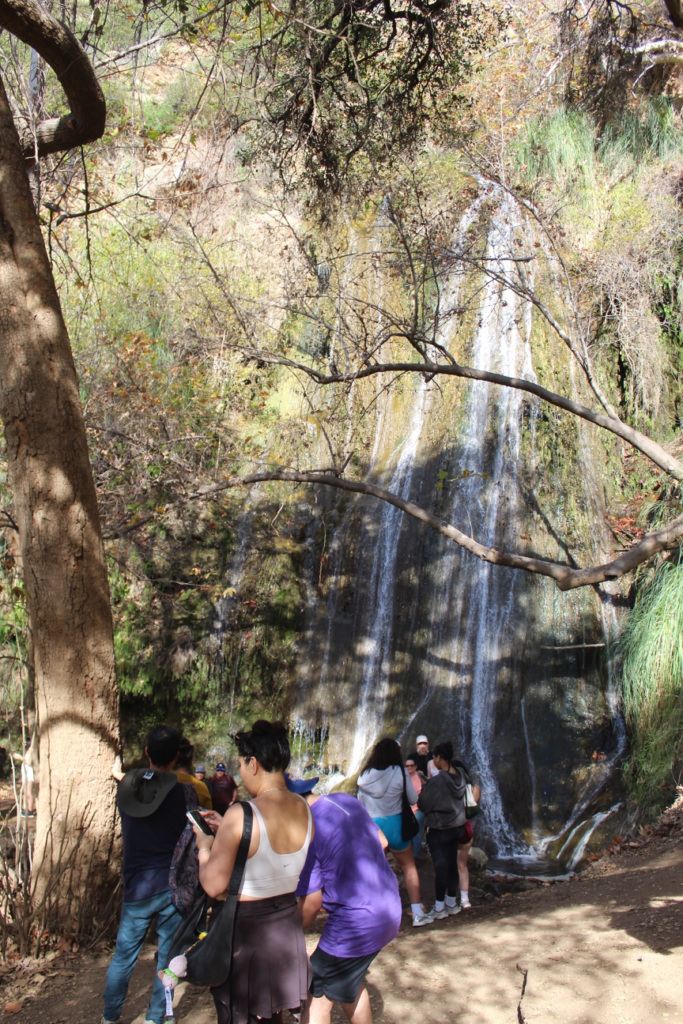
The following photos were taken in mid-January, 2026, as the record-breaking arctic cold snap was freezing the Midwest and East Coast. By contrast, this was Southern California during the same time, a few weeks following those premature heavy rains, and during the unusually long winter warm spell when afternoon temperatures peaked well into the 80s.
Escondido Falls (there is an upper and lower) is a seasonal waterfall near Pt. Dume, Malibu. The Santa Monica Mountains aren’t massive or tall enough to catch snowfall, so most local streams get quick boosts from winter storms and then dry to trickles by mid-summer. During this year, the stream was rejuvenated to an early-season roar by late December until it became difficult to cross. By mid-January (here), the trail was passable again and social media attracted thousands of visitors to crowd what was once a quieter nature experience. But consecutive days and then weeks of warm, dry winter weather extended into February. Discharges decreased again and slopes began drying up in the middle of the normal rainy season. Such seasonal dysfunction offered less impressive waterfall selfie opportunities for hikers basking in the sunny 80-degree afternoons, which is warmer than most summer days along that coastal zone.
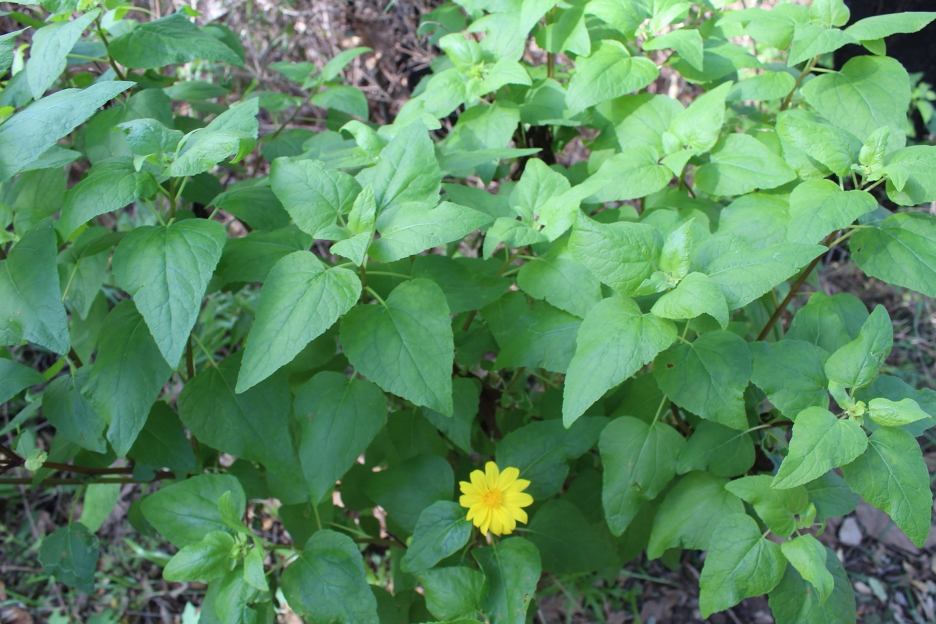
As the name suggests, Canyon Sunflower (Venegasia carpesioides) likes moisture and shade. Responding to early-season drenchings, it sprang into action during the warm, clear days that followed. But the rains stopped for days and then weeks through January and into February in the middle of the traditional rainy season, leaving plants (and some of their annual pollinators) seemingly confused about what to do next as the dry heat in the middle of winter dragged on.
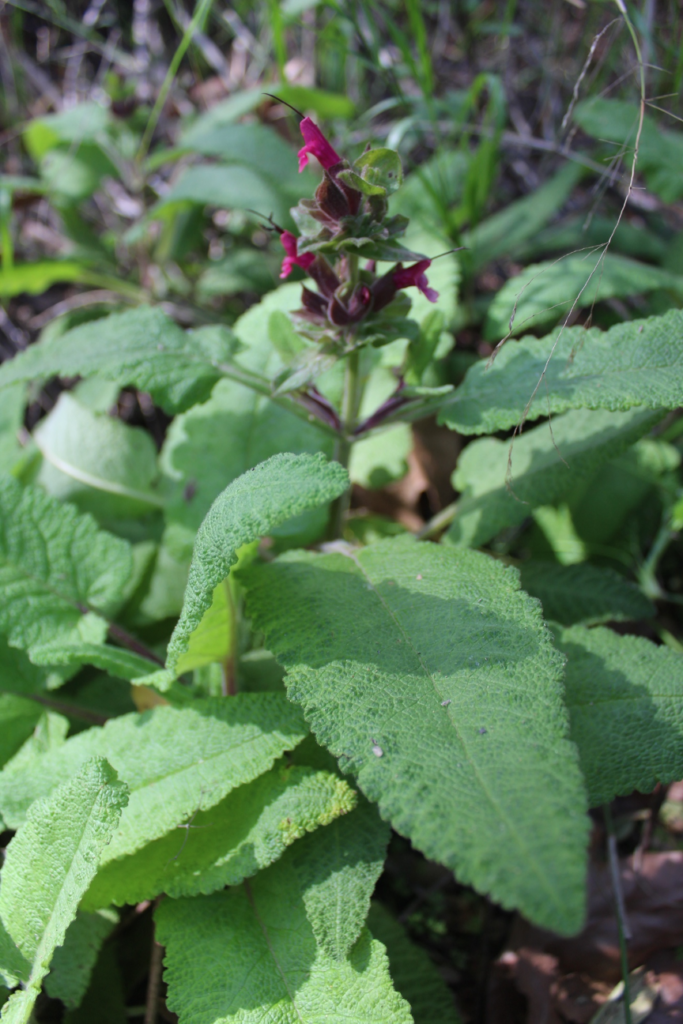
Hummingbird Sage or Pitcher Sage (Salvia spathacea) is another common Southern California species that thrives in mostly shady, damp environments. It also took advantage of the early moisture, only to encounter the warm, dry January-into-February weather pattern oddity.
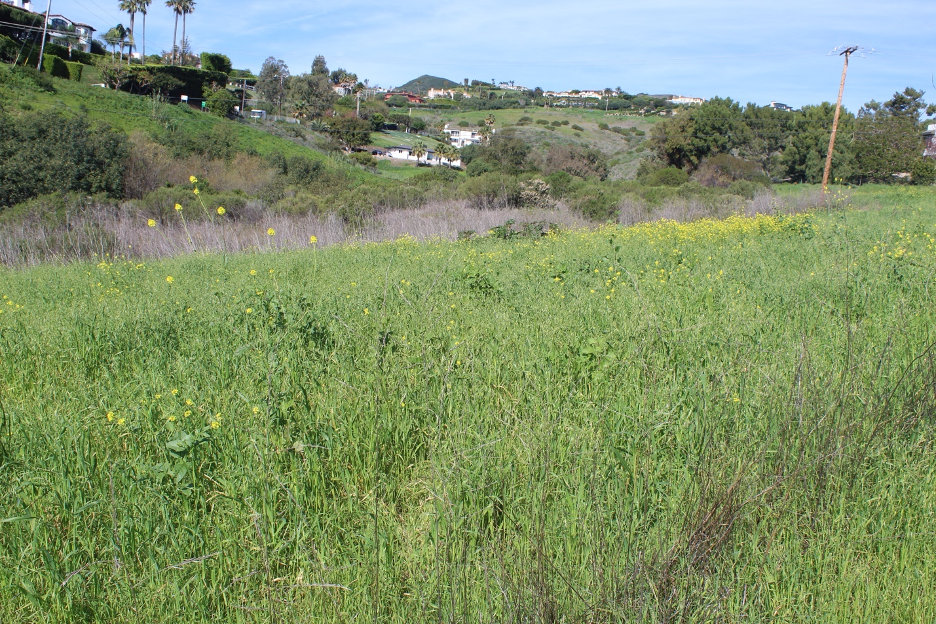
A mix of native flowers were being crowded out by introduced weeds along a trail in the Santa Monica Mountains during January. The yellow mustard and other species were all celebrating saturated soils and an early growing season, but then began struggling again with dehydration and afternoon heat in the middle of winter. Earlier extended periods of stormy low pressure were replaced by persistent fair-weather high pressure and offshore breezes, challenging every organism to adapt. Would the rains return before April, or would all this added biomass quickly dry into flammable fuel waiting for the next wildfire?
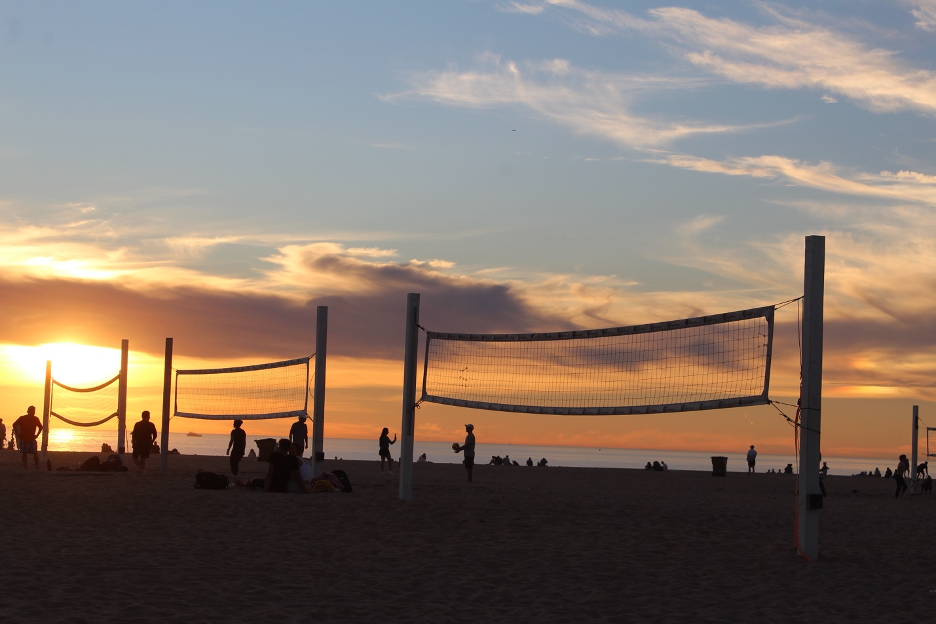
Another January, 2026 afternoon with temperatures in the 70s and 80s comes to an end across Southern California beaches. Notice the sundog to the right of the volleyball net. Sundogs sometimes form as pieces of halos when light is refracted at 22-dgree angles from the sun by horizontally-aligned ice crystals within the high cirrus clouds.
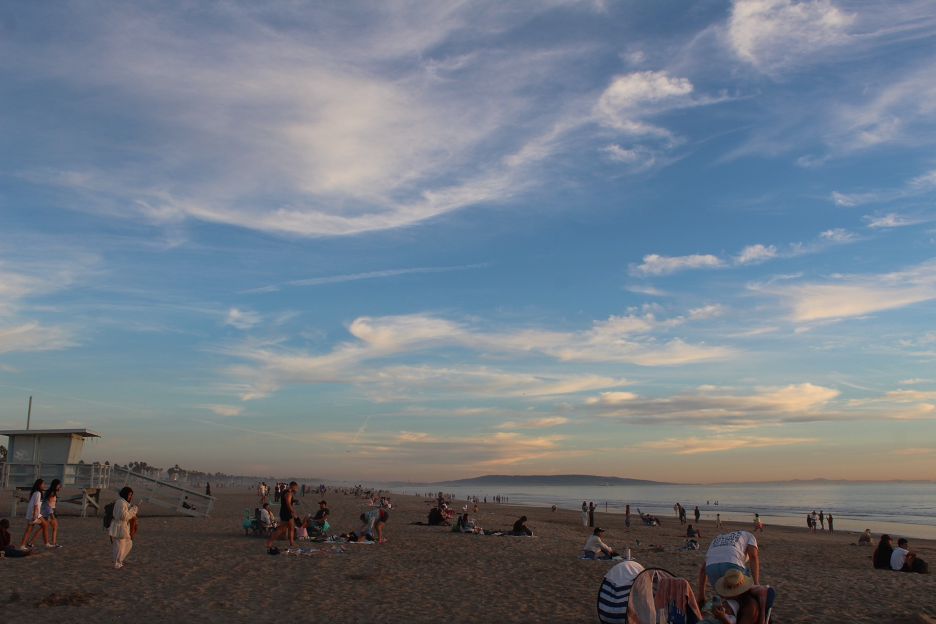
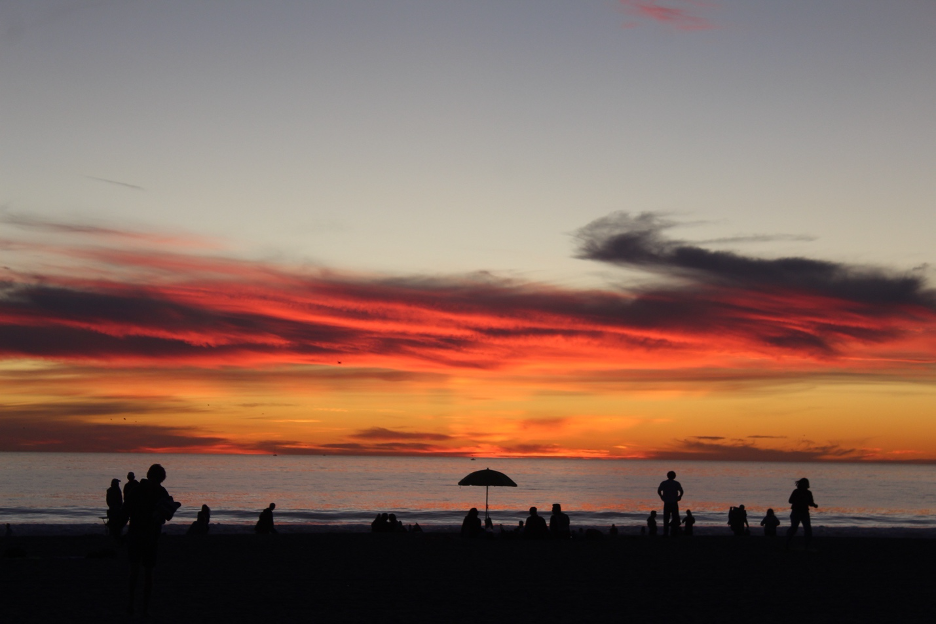
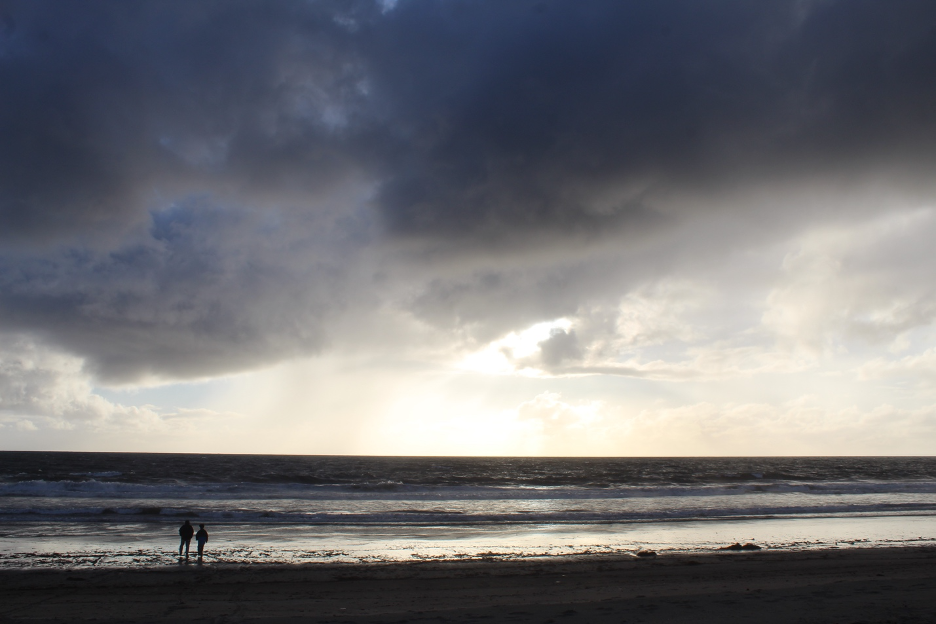
Thousands of people flocked to Southern California beaches to enjoy unusually long periods of warm sunny days that would stretch into February, 2026. These nature lovers waited to see a spectacular sunset. They might not believe that millions of people were sheltering from a record string of well-below freezing days with ice and snow that extended east of the Rockies to the East Coast.
Days turned into weeks of sunny skies, offshore breezes, and warm temperatures. Beach weather ruled during the middle of Southern California’s rainy season from January into February, 2026. There’s no marine layer here, allowing beachgoers to watch the sunset reflect off high cirrus clouds. (Some Northern and Central California inland valleys remained shrouded in winter’s haze and fog trapped below the high pressure.) Many of us were wondering what other surprises nature might have in store as we look forward.
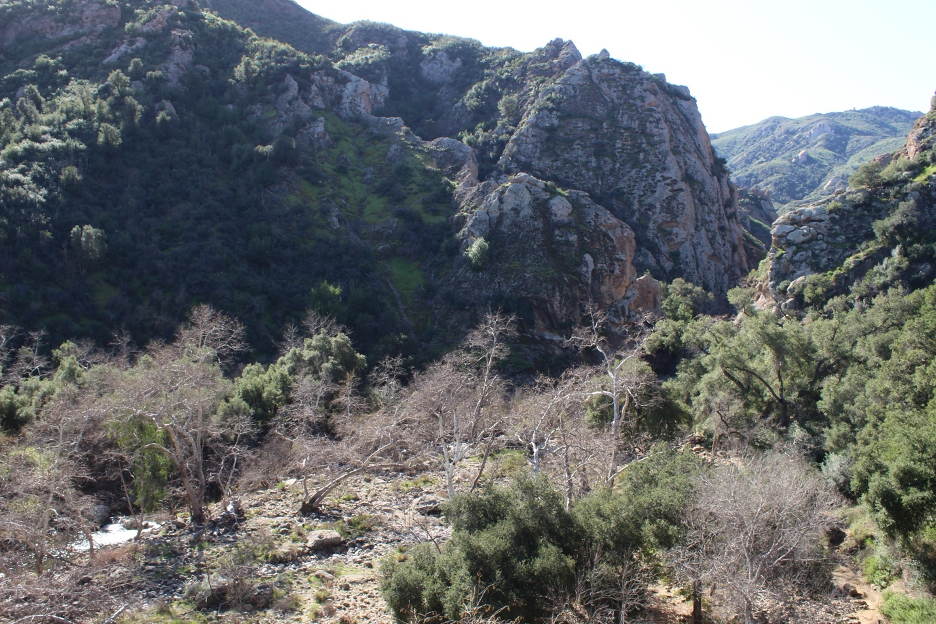
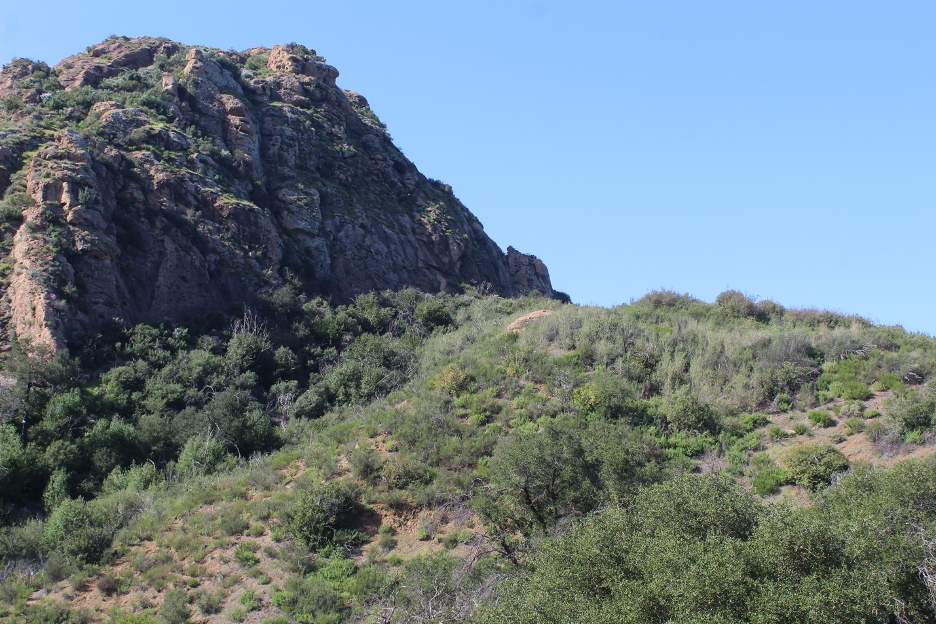
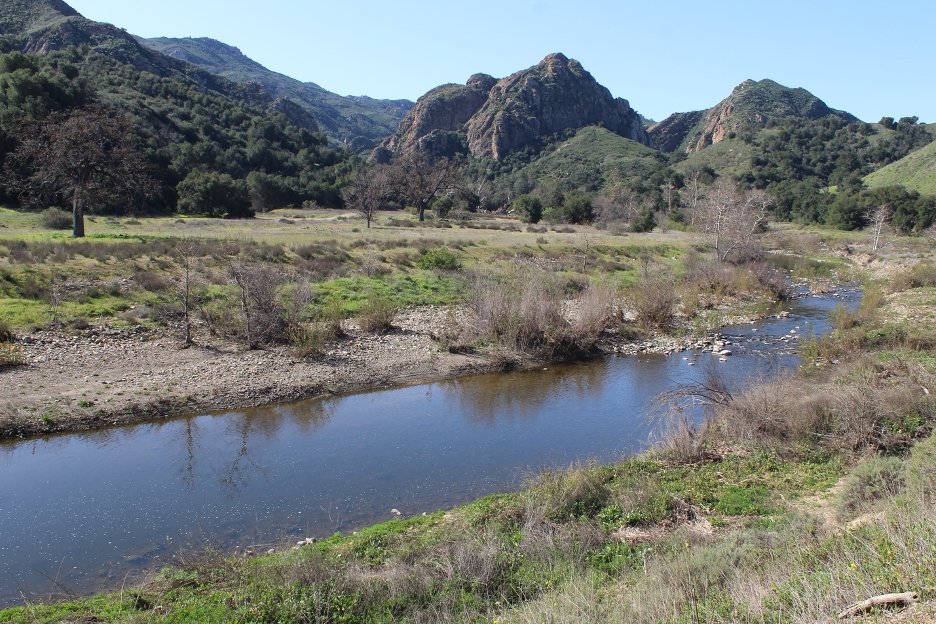
Malibu Creek slices through Conejo Volcanics rocks at Malibu Creek State Park in early February, 2026. Dormant deciduous trees (such as sycamore) lining this riparian woodland and some surrounding valley oaks are evidence that this is a mid-winter scene, except it’s another in a long string of sunny days with afternoon temperatures soaring into the 80s.
Coastal sage scrub, chaparral, and oak woodlands seen here and throughout the Santa Monica Mountains first benefited from early heavy rains that marked a premature start to the 2025-2026 rainy season. (This landscape is still recovering from a 2018 fire.) But the rains abruptly stopped during what is normally the wettest time of year. When I took this photo, it hadn’t rained for a month and plant communities were already drying out, thanks to warm, dry, offshore winds.
Malibu Creek had become an impressive torrent just one month earlier, following an entire season’s rainfall in about two short months. But by early February, 2026, it hadn’t rained for more than a month and this and other creeks throughout the region were already receding during the time of year when they are usually rising. Meanwhile, scanty mid-winter snowpacks dwindled in higher ranges across the western states. We could only speculate about the next hydrometeorological whiplash that might challenge California and The West.
Episode Six: February’s Snowstorms Melt into the Record Heatwaves of March
Incredibly, the wild swings in our weather pendulum continued as February advanced into March, 2026. Mountain slopes left bare into the middle of winter were suddenly covered with several feet of snow that accumulated during one February week of storms. The radical switch from record warmth to awesome snowstorms briefly eased concerns about historic water shortages throughout western mountain ranges. Unfortunately, this sudden reversal also produced dangerous avalanche conditions, including the deadliest avalanche in modern California history, which buried 9 skiers above Lake Tahoe. Incredibly, this was followed by the hottest March on record with the hottest temperatures ever recorded in the US so early in the year. Snowpacks rapidly disappeared in western mountains, forcing many ski resorts to close early, some leaving behind one of the worst (and most erratic) ski seasons in history. The western water crisis was suddenly in full swing again, perhaps worse than ever in watersheds such as the Colorado River. The following chronological image and photo essay illustrates how these whacky whiplashes defined our winter-spring season of 2026.
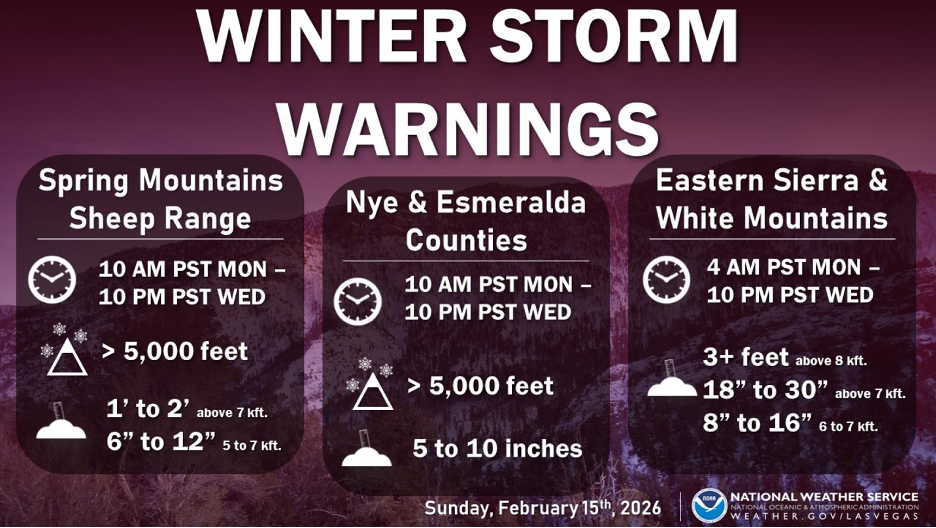
We begin with that sudden change from no snow warmth to blizzard conditions in February; consider these forecasts from the National Weather Service that were spot on for the week that started on February 16: Tuolumne Meadows, Yosemite National Park: Monday Snow. High near 33. Wind chill values as low as 12. South southwest wind around 10 mph, with gusts as high as 35 mph. Chance of precipitation is 100%. Total daytime snow accumulation of 10 to 14 inches possible. Monday Night Snow before 10pm, then snow showers between 10pm and 1am, then snow after 1am. Some thunder is also possible. Low around 6. Wind chill values as low as -7. West southwest wind 10 to 15 mph, with gusts as high as 35 mph. Chance of precipitation is 100%. New snow accumulation of 10 to 14 inches possible. Tuesday Snow before 4pm, then snow showers after 4pm. Some thunder is also possible. High near 25. Wind chill values as low as -10. Breezy, with a southwest wind 15 to 20 mph, with gusts as high as 55 mph. Chance of precipitation is 100%. New snow accumulation of 15 to 21 inches possible. Tuesday Night Snow showers before 10pm, then snow after 10pm. The snow could be heavy at times. Some thunder is also possible. Low around -1. Wind chill values as low as -14. West southwest wind around 15 mph, with gusts as high as 45 mph. Chance of precipitation is 100%. New snow accumulation of 14 to 20 inches possible. Wednesday Snow, mainly before 4pm. High near 19. West southwest wind around 10 mph, with gusts as high as 30 mph. Chance of precipitation is 80%. New snow accumulation of 1 to 2 inches possible. Wednesday Night Snow likely, mainly after 10pm. The snow could be heavy at times. Mostly cloudy, with a low around 2. South southwest wind around 5 mph, with gusts as high as 15 mph. Chance of precipitation is 60%. New snow accumulation of 2 to 4 inches possible. Thursday Snow. The snow could be heavy at times. High near 25. West southwest wind 5 to 10 mph, with gusts as high as 30 mph. Chance of precipitation is 90%. New snow accumulation of 5 to 9 inches possible. Thursday Night Snow likely, mainly before 10pm. Mostly cloudy, with a low around -1. West southwest wind around 5 mph, with gusts as high as 20 mph. Chance of precipitation is 70%.
Here’s a summary of exceptionally accurate warnings from the NWS for the mountains of Northern California and the Sierra Nevada as the cold trough approached: WINTER STORM WARNING NOW IN EFFECT UNTIL 10 PM PST THURSDAY… Heavy snow accumulations of up to 4 to 8 feet at higher elevations with wind gusts of 45-55 mph. Dangerous to near impossible travel conditions with chain controls and road closures. Low visibility due to a combination of wind and heavy snow.
The following images illustrate such abrupt changes that transformed landscapes from February through March as winter flipflopped into spring.
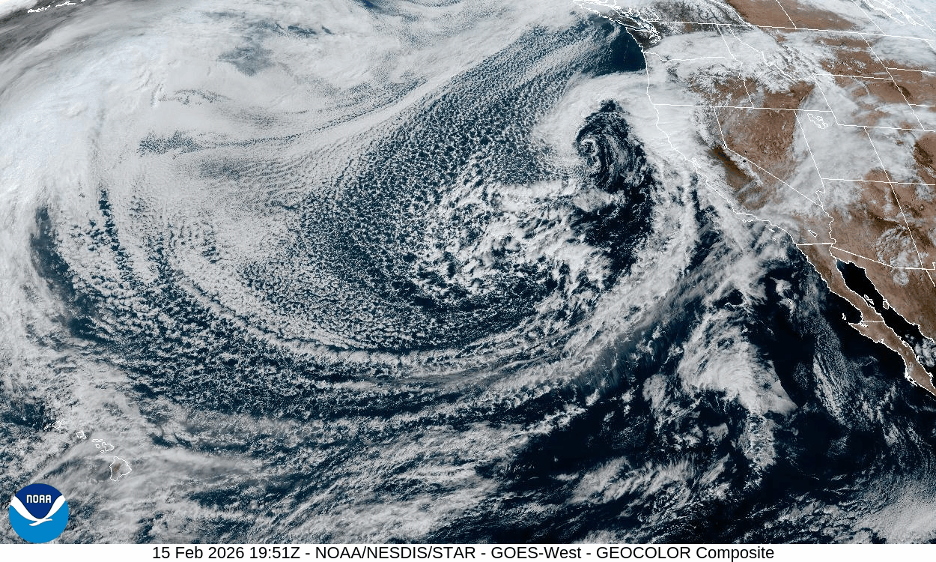
On February 15, a massive deep, cold trough of low pressure had dropped into the eastern Pacific, gathering moisture and heading for California and other western states. The snow that hydrologists and struggling ski resorts dreamed about was on its way. Source: NOAA/National Weather Service.
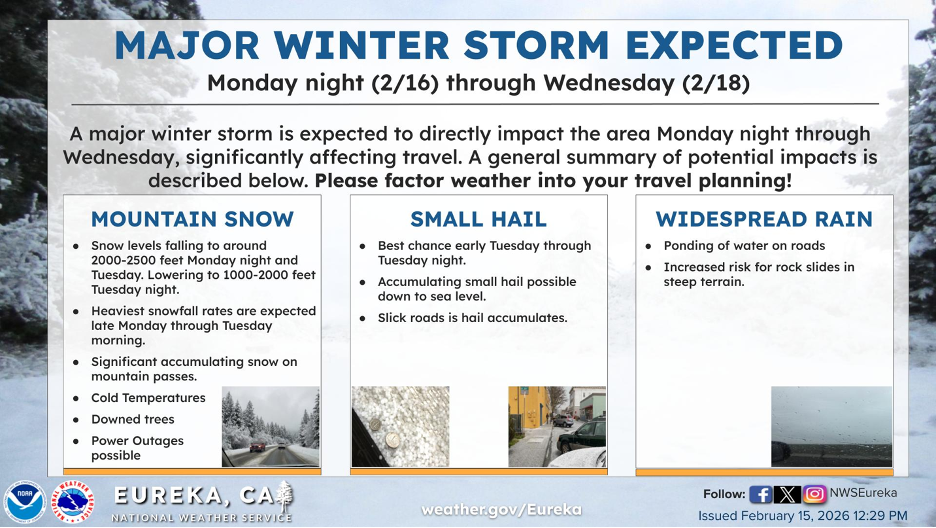
The NWS Office in Eureka warned of heavy mountain snow down to very low elevations, generated by a powerful winter storm that would eventually sweep across the entire state.
The NWS warned how this massive cold storm would dump abundant snow even on our rain shadow mountain ranges into Nevada.
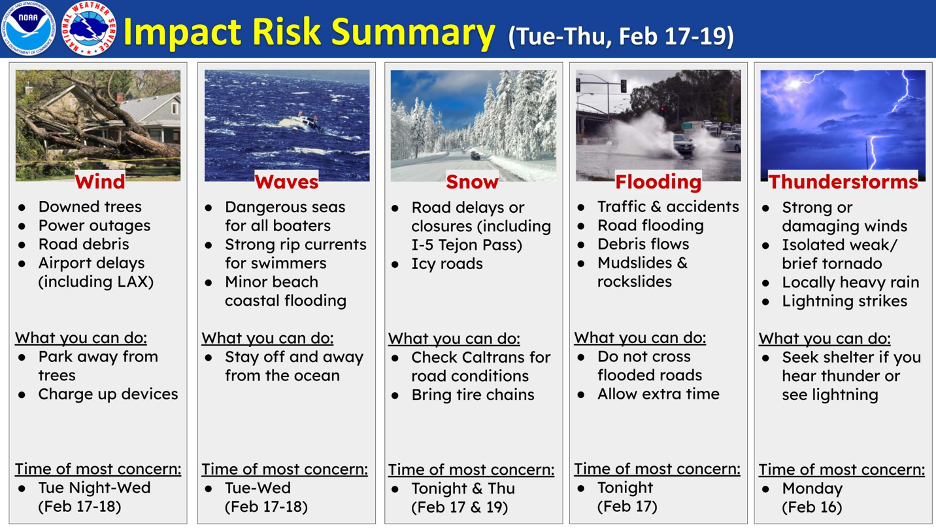
The NWS Office in LA anticipated the problems and dangers caused by the arrival of such a deep, extensive trough of low pressure. Because it was sandwiched between uncharacteristically hot, dry spells, Southern Californians would be jarred out of their perfect weather paradise and into a few days of severe winter.
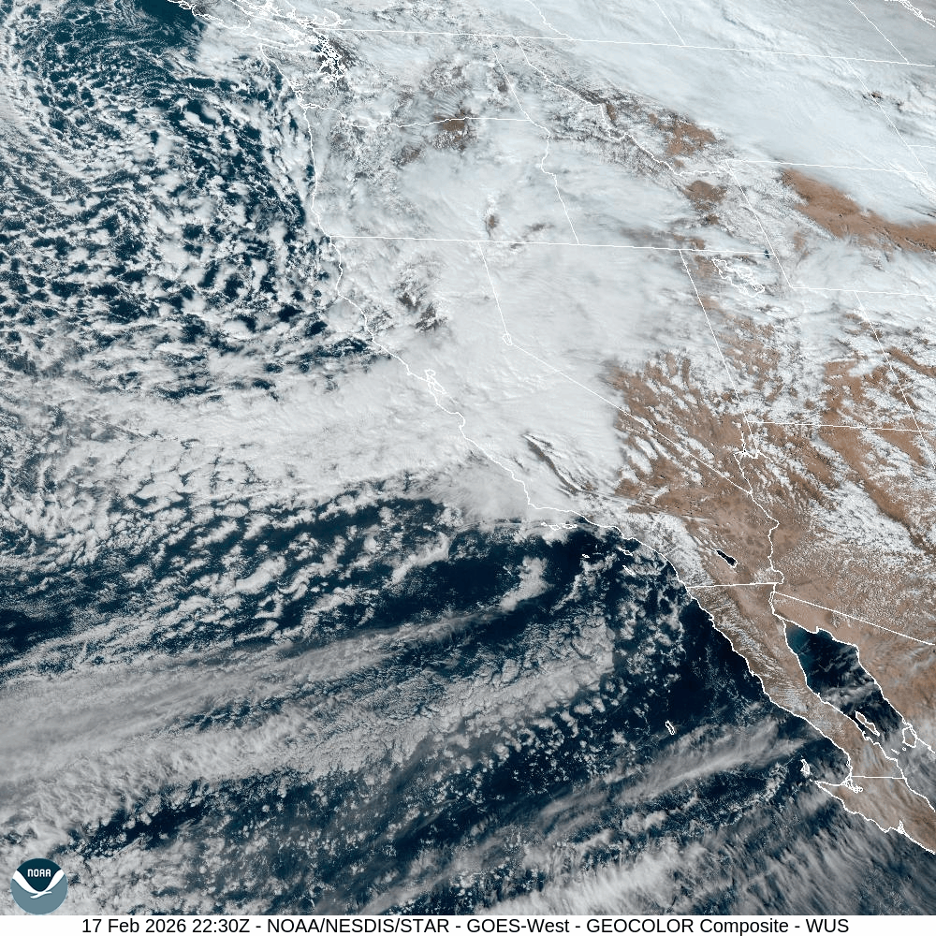
By February 17, the trough was circulating into California and pushing a cold front that would bring heavy snow to cover every mountain range down to San Diego County. Source: NOAA/National Weather Service.
It’s hard to believe that high pressure drove temperatures into the 80s to produce chamber of commerce beach weather just a few days earlier. But heavy showers and cold winds dominated for nearly a week in mid-February all the way into Southern California.
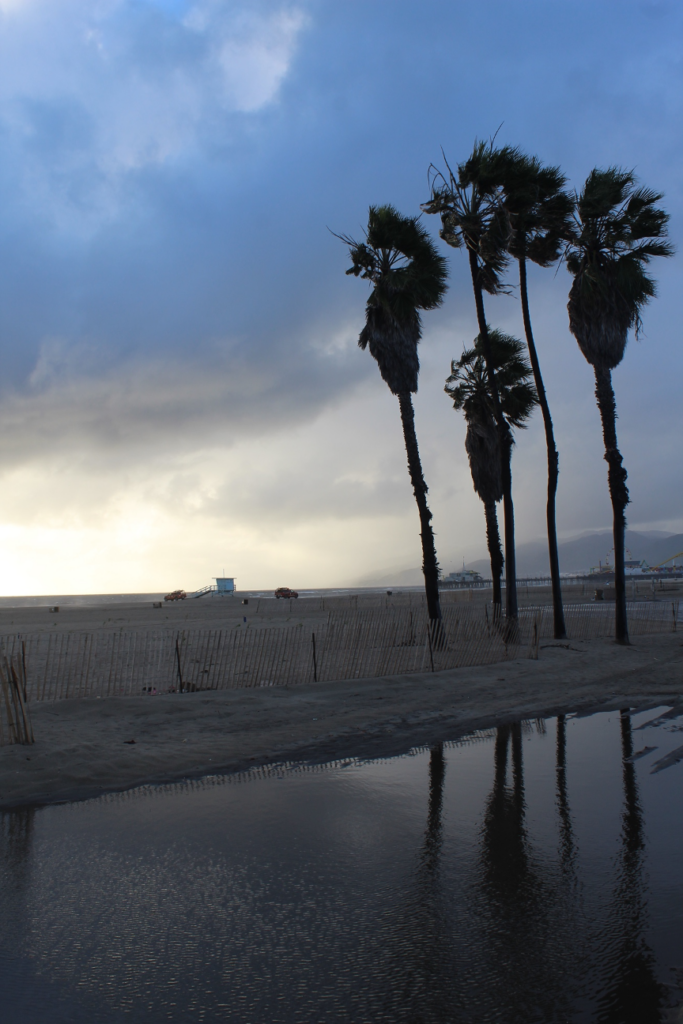
Unstable showers and thunderstorms followed the mid-February front that dropped inches of rain on coastal elevations and several feet of snow in the mountains. Blustery conditions cleared the beaches of the thousands of visitors who had reveled here during unseasonably hot temperatures just days earlier.
These cumulus clouds boiled up in the cold, moist, unstable air that followed February’s big Pacific storm and its cold front.
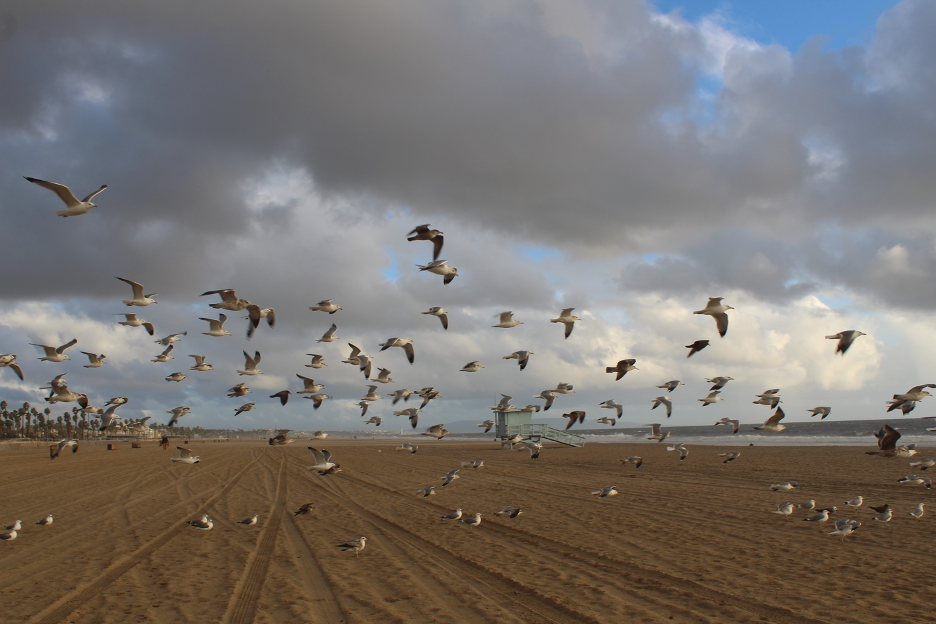
Startled gulls get extra lift by flying into the blustery northwest winds following the cold front.
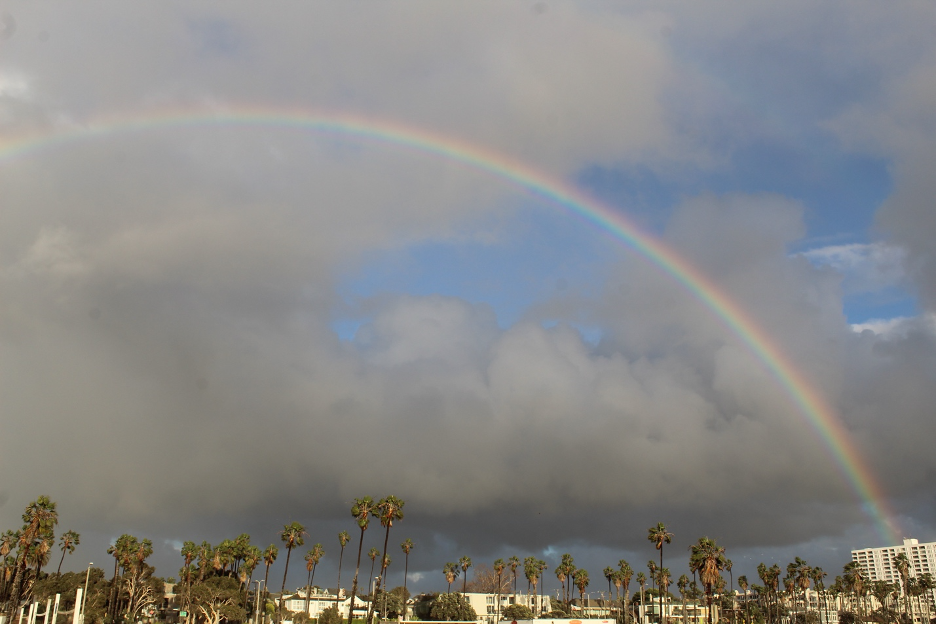
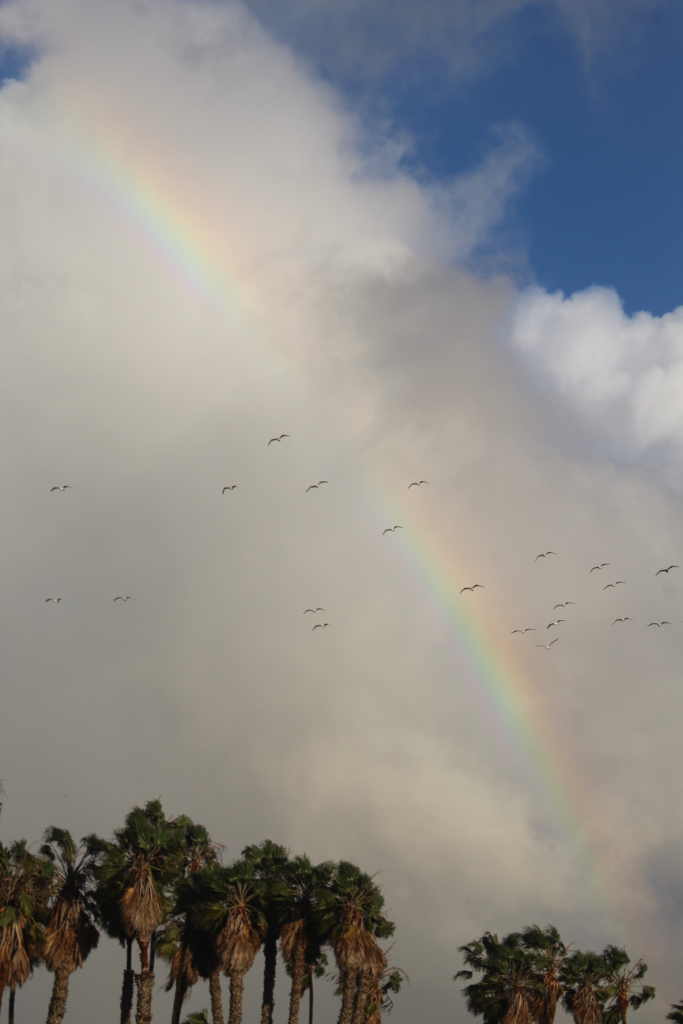
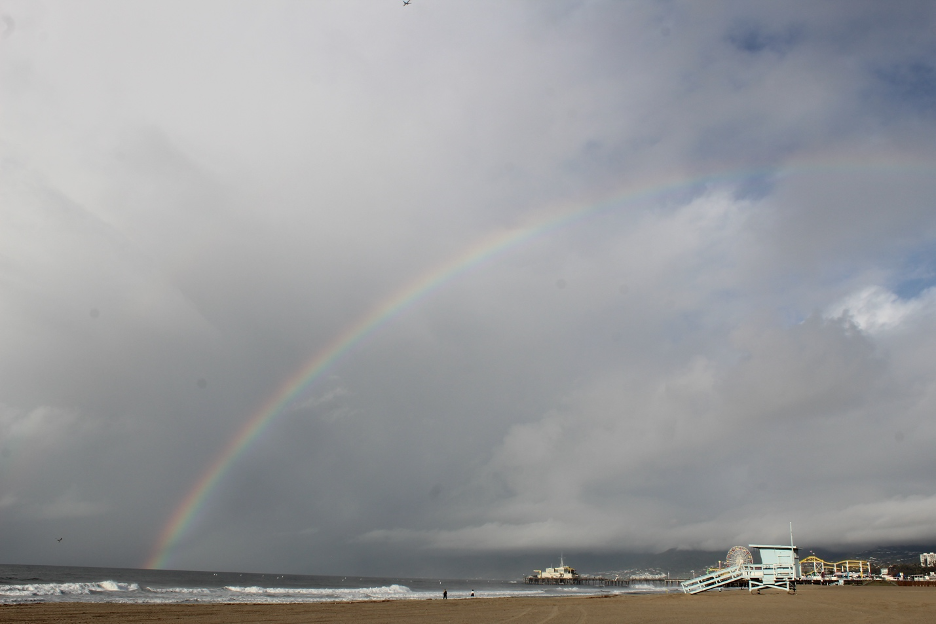
We recognize many advantages to these winter storms that carry precious water off the Pacific and into western states. Here, the late afternoon sun behind us peaks through gaps in unstable cumulus clouds to shine into showers, producing a classic rainbow at about 42 degrees. The storm is moving east of us, prompting the sometimes-reliable weather proverb, “Rainbow at night, sailor’s delight.”
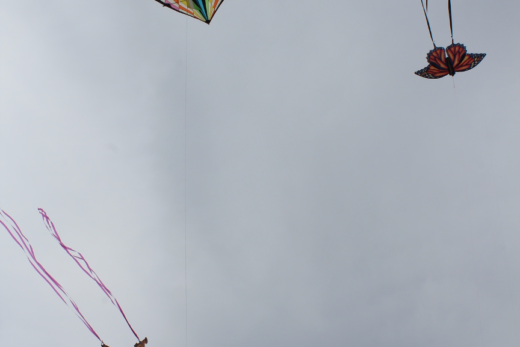
Flying toward shelter from the storm? As our nourishing cold mid-February storm barreled through, could these birds recall the recent hot, dry days that were uncharacteristic of coastal California? Will they adapt to the next long hot, dry spells that will set records well into March?
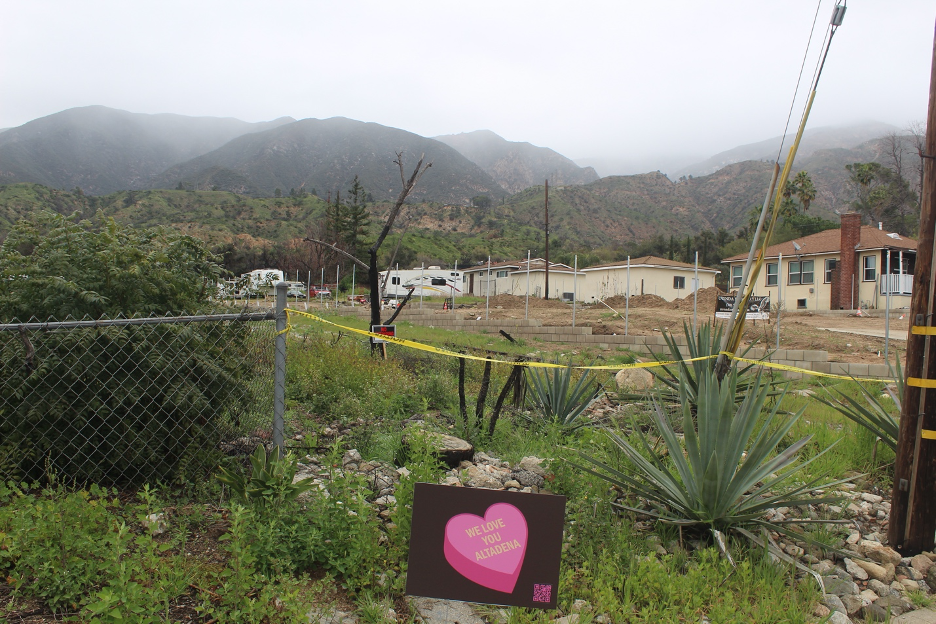
Last year’s firestorm tragedies, summarized in a previous story on our website, could have been avoided if our seasonal rains had arrived earlier, as they did this year. As we look across some empty lots that remain from a vibrant Altadena neighborhood that was burned to the ground, we can also see February showers watering burnt slopes of the San Gabriel Mountains. What a difference a year makes! This season’s moist soils and vegetation prevented the hot, dry Santa winds that followed from fanning major blazes.
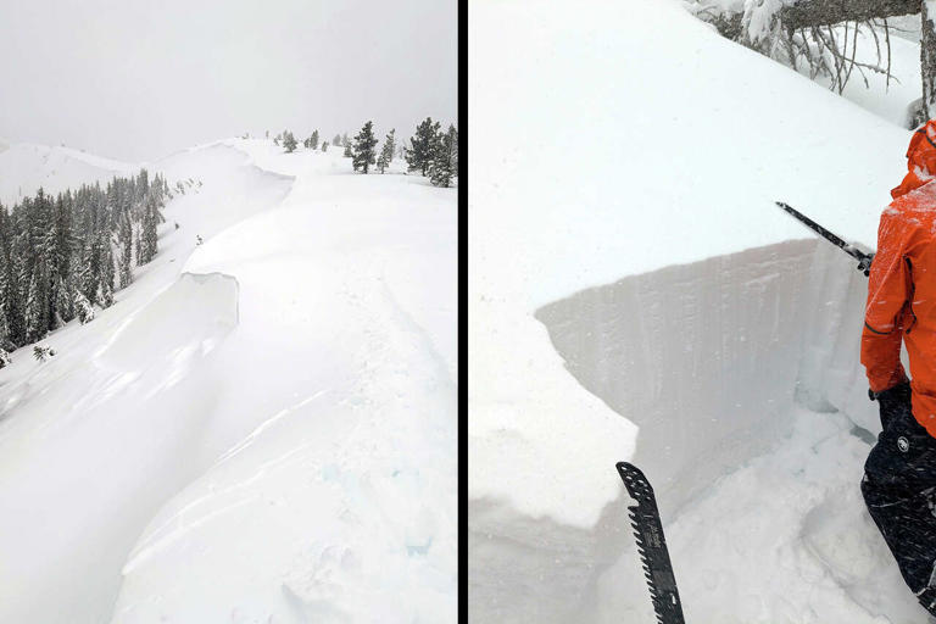
Sierra Avalanche Center staff dig into layers of fresh snow dumped at higher elevations within just a few mid-February snowstorm days. You are looking at prime avalanche conditions that suddenly turned deadly above Lake Tahoe.
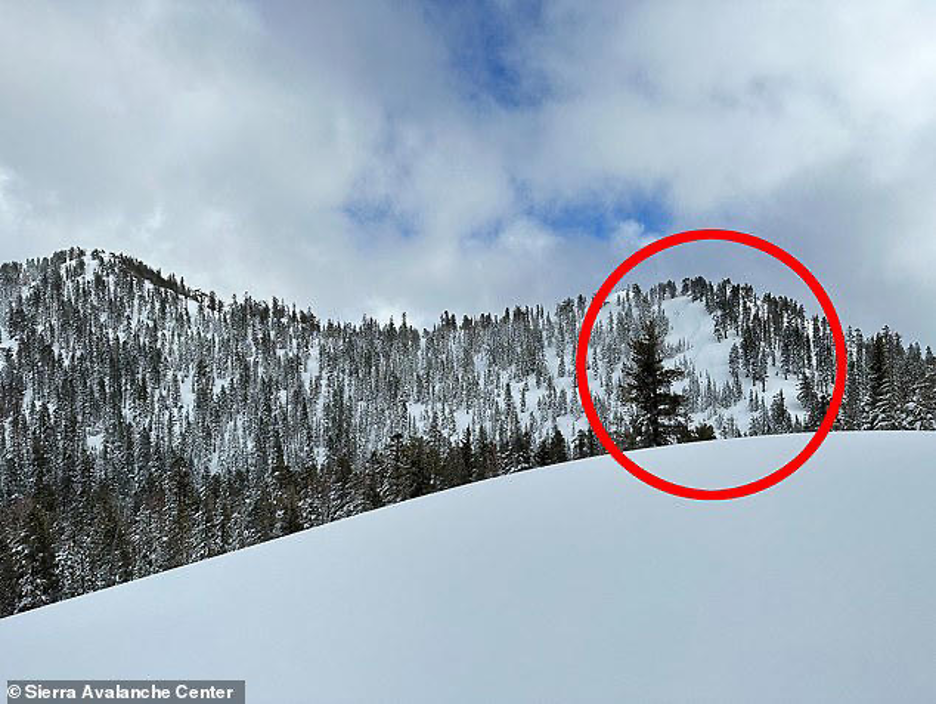
This is looking toward Perry’s Peak near Castle Peak following the deadly avalanche located above 8,300 ft near Lake Tahoe on Feb 17, 2026. Sierra Avalanche Center.
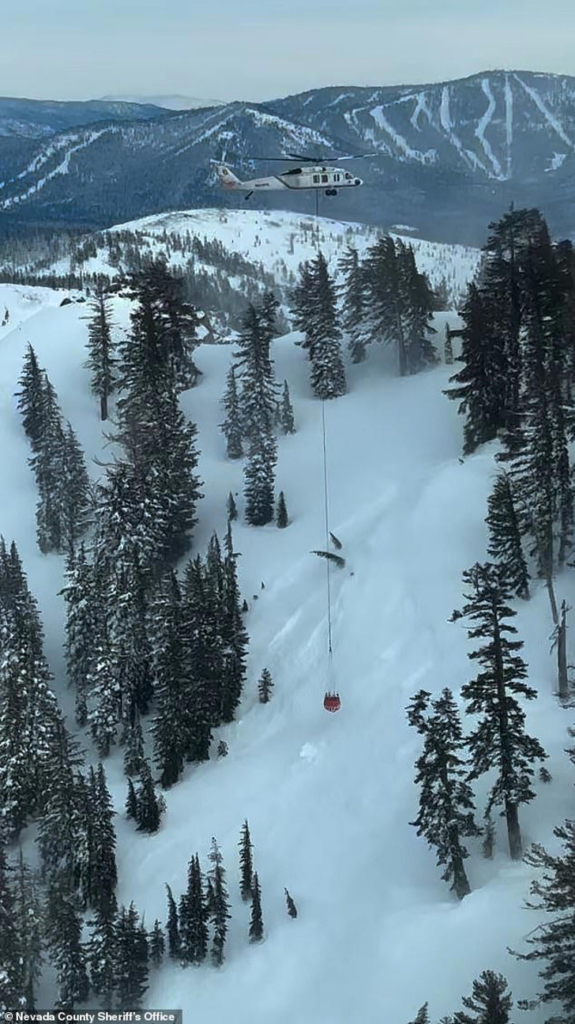
This PG&E helicopter hovers near Perry’s Peak after the snowstorm and deadly February avalanche. The fresh unstable powder rests on top of older thin layers of snow that were exposed to warmer temperatures for weeks. Nevada County Sherriff’s Office.
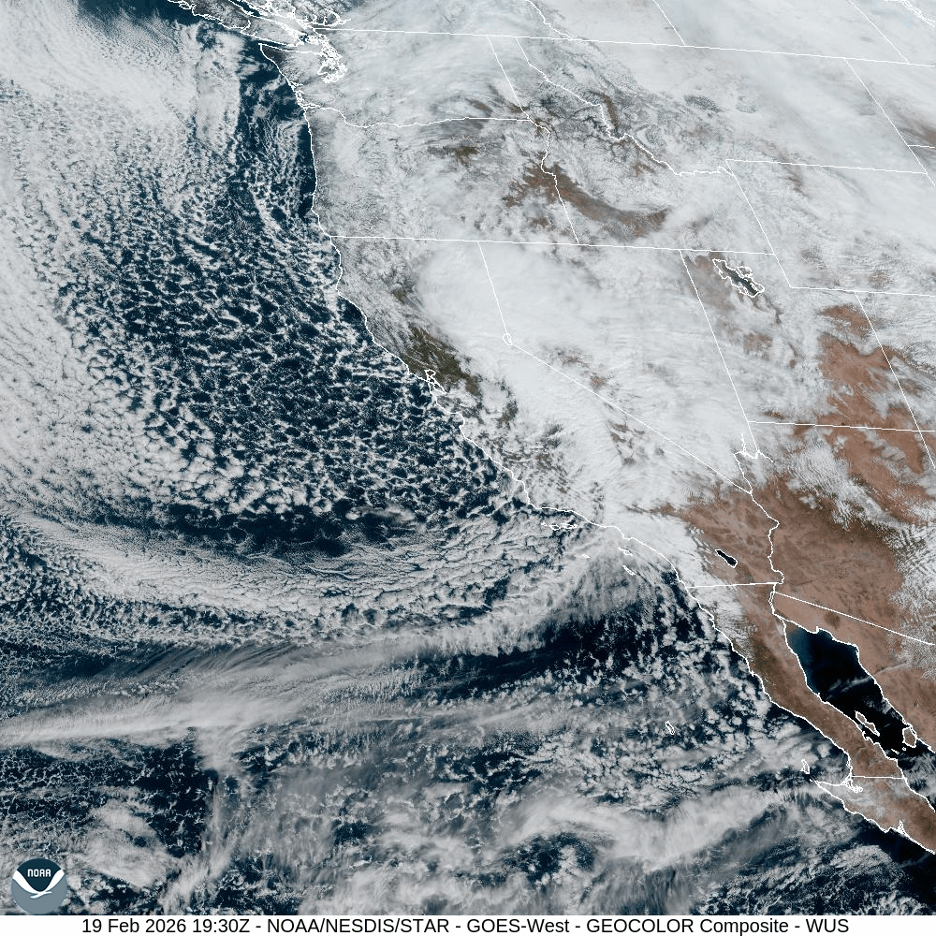
On February 19, a trailing front and wave of cold showers sweeps across California’s well-watered wetlands and mountain snowpacks, thanks to the last few days in a quick series of Pacific storms. Note the unstable popcorn cumulus clouds forming off the coast as cold air from the Gulf of Alaska sweeps over Pacific Ocean waters and heads for California. Source: NOAA/National Weather Service.
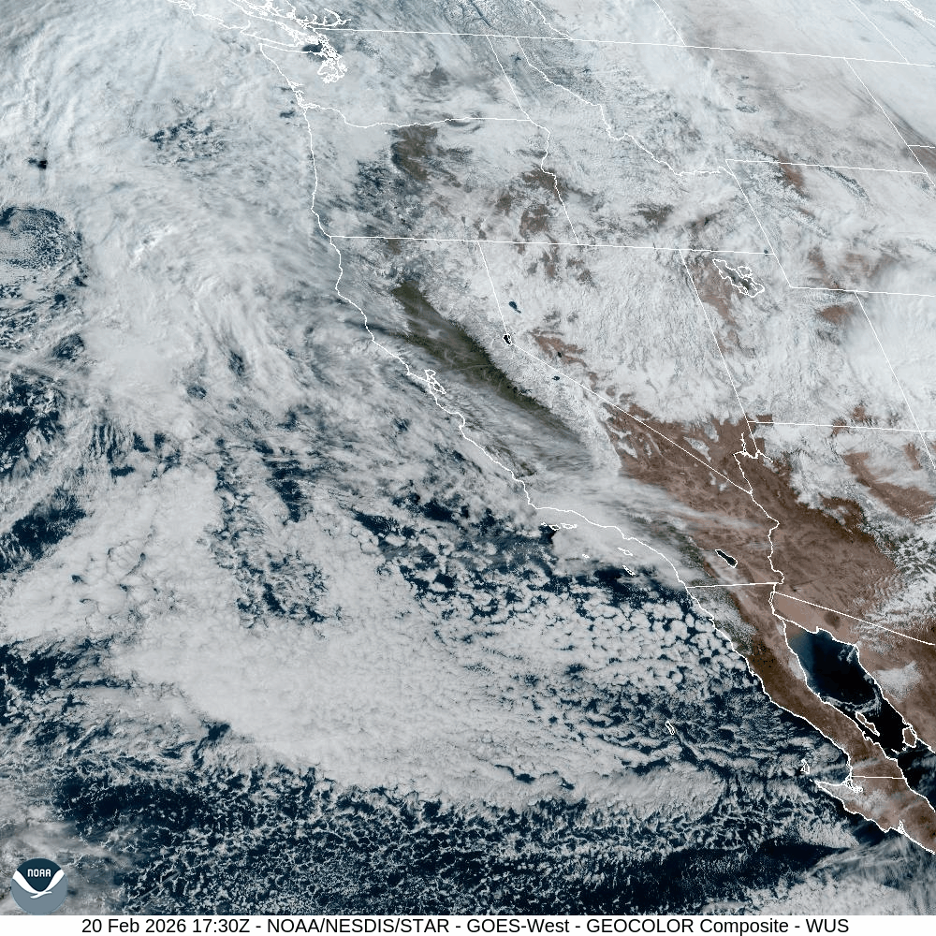
By February 20, following the mid-February storms, some high clouds drift off the Pacific. But look more carefully and you’ll notice that most of the white surfaces on the Sierra Nevada and other California ranges into the western states are snowpacks, not clouds. The thick white blankets cover surfaces that were mostly bare just several days earlier. Source: NOAA/National Weather Service.
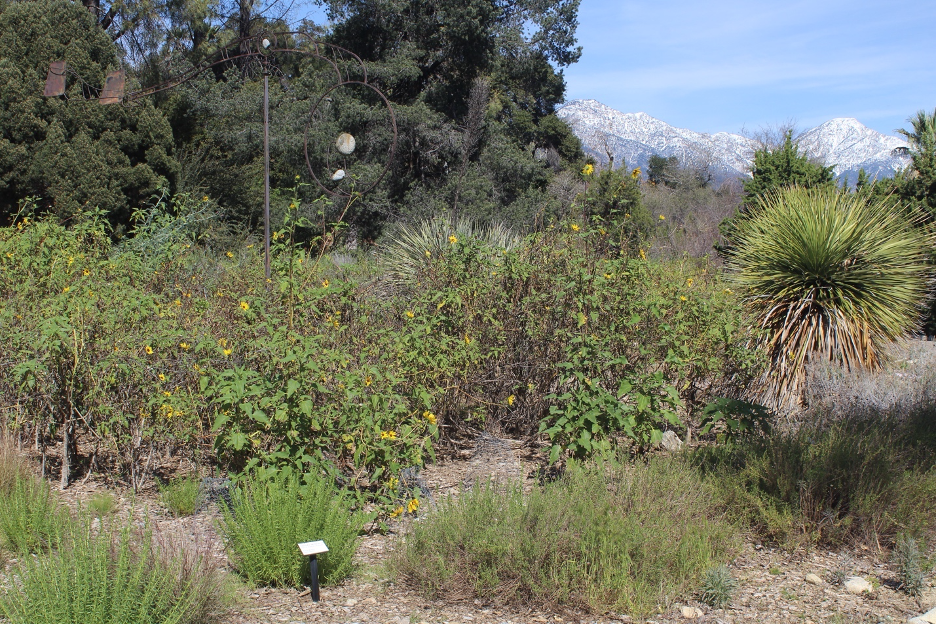
Early wildflowers decorate late February landscapes at the California Botanic Garden. Temperatures are soaring into the 80s as we view toward the San Gabriel Mountains and melting snow left by recent storms as the weather whiplash continues.
Extensive snowpacks left by mid-February storms look down on Los Angeles. Within two short weeks, the snow had disappeared from these views toward the distant San Gabriel Mountains.
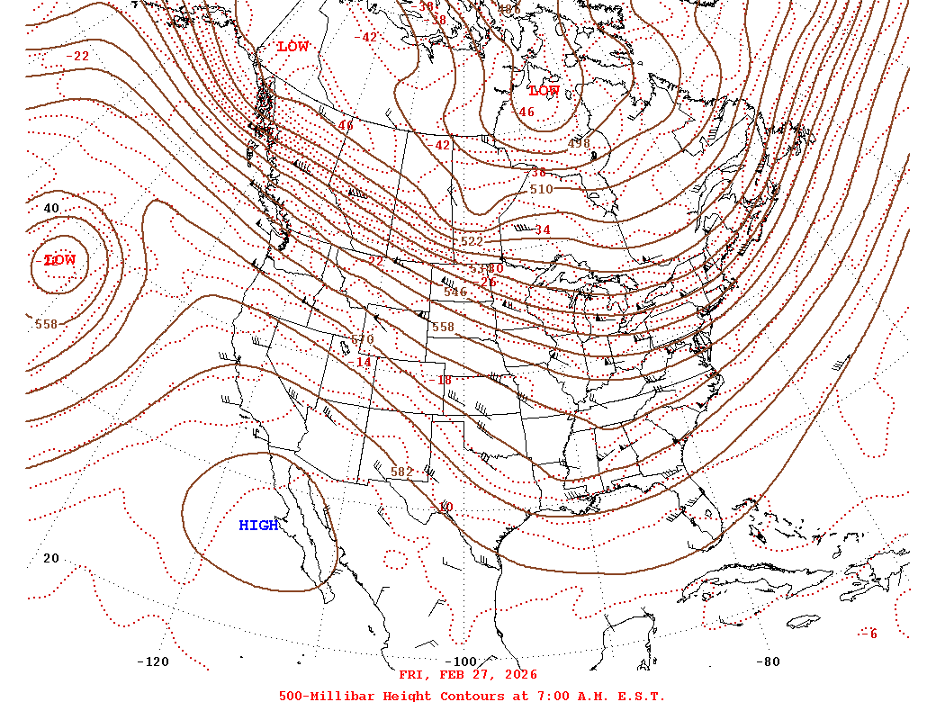
By late February, winter storms were just a memory. In this 500 mb chart on February 27, notice strong high pressure pushing up from the south, bringing another round of record hot and dry weather to California. A few storms could only clip the very northern edge of the state as temperatures soared to record levels in a repeat performance of September-like weather. Source: National Centers for Environmental Prediction, Weather Prediction Center.
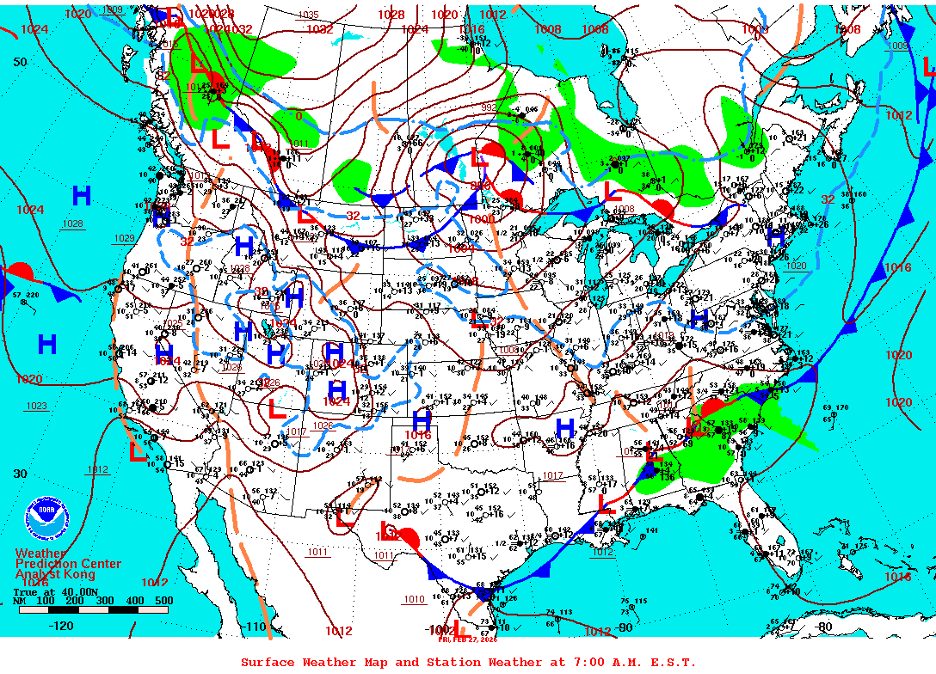
At the surface, high pressure dominated throughout the western states again, blocking Pacific storms and any other turbulent instability. By February 27, western snowpacks were quickly melting away below the warm, dry air. Source: National Centers for Environmental Prediction, Weather Prediction Center.
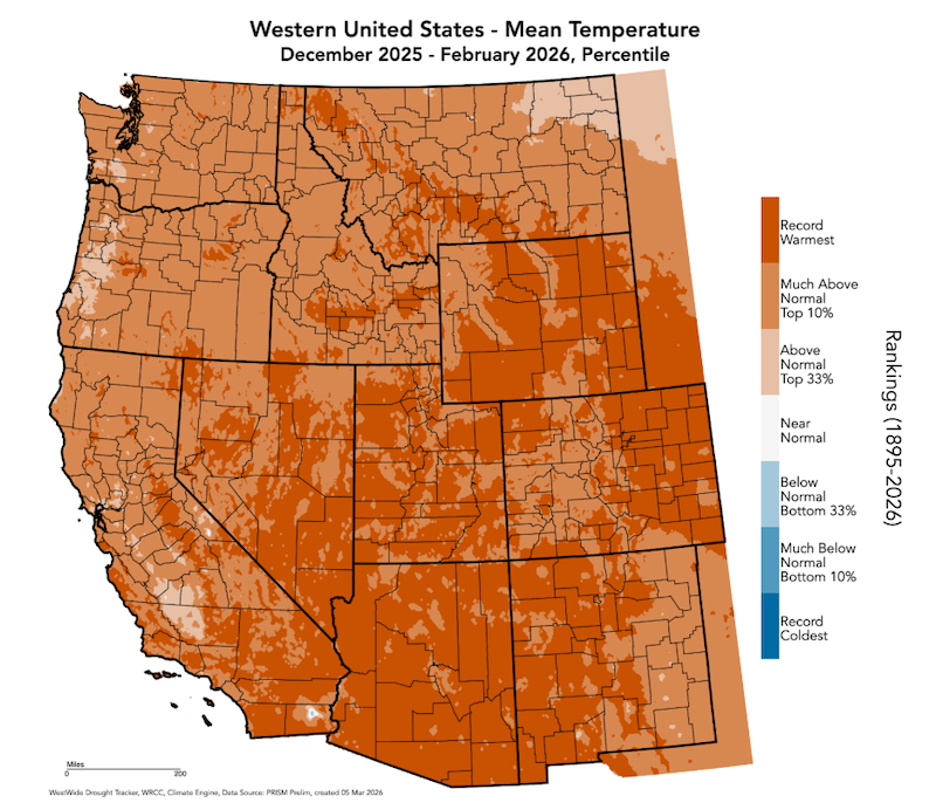
The winter of 2025-2026 was the warmest on record for much of California and the West. This milestone would soon (and remarkably) be overshadowed by the hottest March on record, with many locations recording their hottest March temperatures ever, including a few that breached 110 °F. Source: Worldwide Drought Tracker, WRCC, Climate Engine.
By March 7, a massive high-pressure dome continued to rule over California, barely penetrated by a stream of thin high clouds. Subsidence and offshore winds blowing out of the high pressure pushed any moisture far out to sea, while the dry heat already defrosted what were impressive snowpacks just two weeks earlier. Source: NOAA/National Weather Service.
If this March 18, 2026 500mb map looks suspiciously similar to the previous late February map, you get the big picture. Stubborn, massive record-breaking high pressure dominated the southwest throughout this week and for much of the month. Descending air masses were compressed, consistently breaking daily high temperature records until many California and other western locations experienced their highest temperatures ever for March during this hottest March on record. Source: National Centers for Environmental Prediction, Weather Prediction Center.
The surface map (March 18, 2026) was, again, also dominated by extensive high pressure that kept western states warm and dry. February’s snowpacks were the victims of the summer-like weather that ruled in late-winter and early-spring. In California, offshore breezes and compressional heating spread toward the immediate coast on some days, where temperatures soared into the 90s, after pushing over 100 °F in some inland valleys. On other days, cooler shallow marine layers with fog were trapped along and near the beaches while inland regions baked in the sun. Southwestern ecosystems were dehydrating fast, far ahead of annual norms. Source: National Centers for Environmental Prediction, Weather Prediction Center.
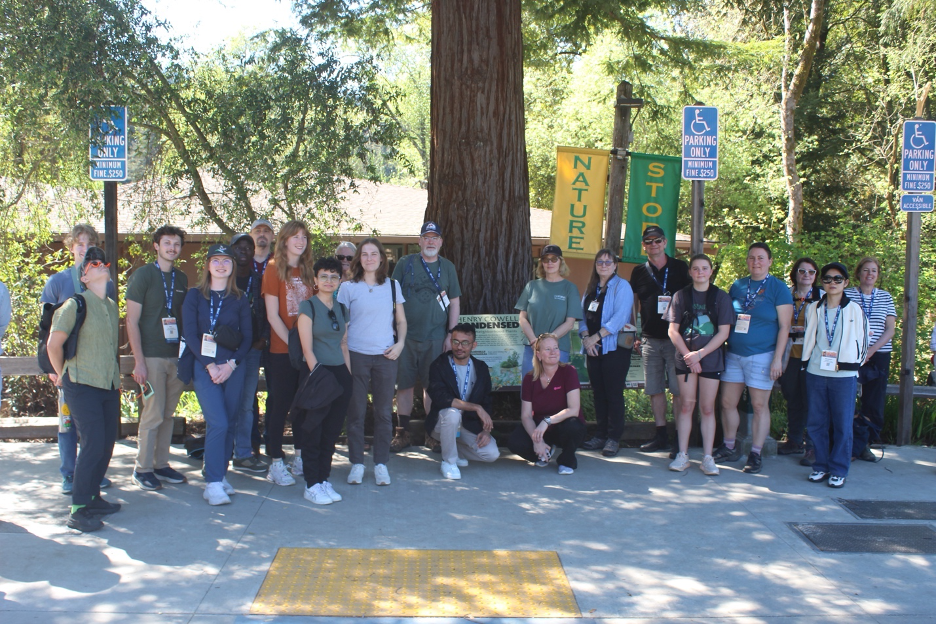
On March 18, 2026, I led a bus full of researchers from around the world (during the annual AAG Conference) into coast redwood forests (burned and unburned) of the Santa Cruz Mountains. No person preparing for this adventure would expect to encounter 90-degree temperatures in March; but that’s what we got. These tallest trees in the world (Sequoia sempervirens) depend on cool, moist sea breezes to keep evapotranspiration rates low. In such unprecedented March heat, we were reminded how these wild weather whiplashes are also challenging our ancient giants.
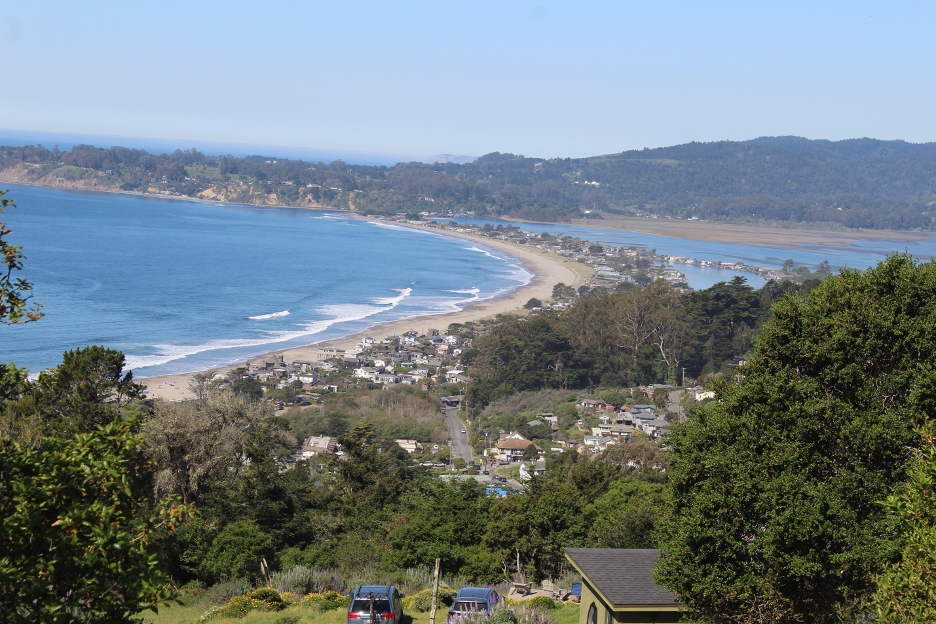
On March 19, Stinson Beach and Bolinas Lagoon basked in the unprecedented sunny warm spell that put an exclamation mark on March, 2026 in Northern California. Residents who might expect these conditions in September were wondering how March could be warmer than most summer days here.
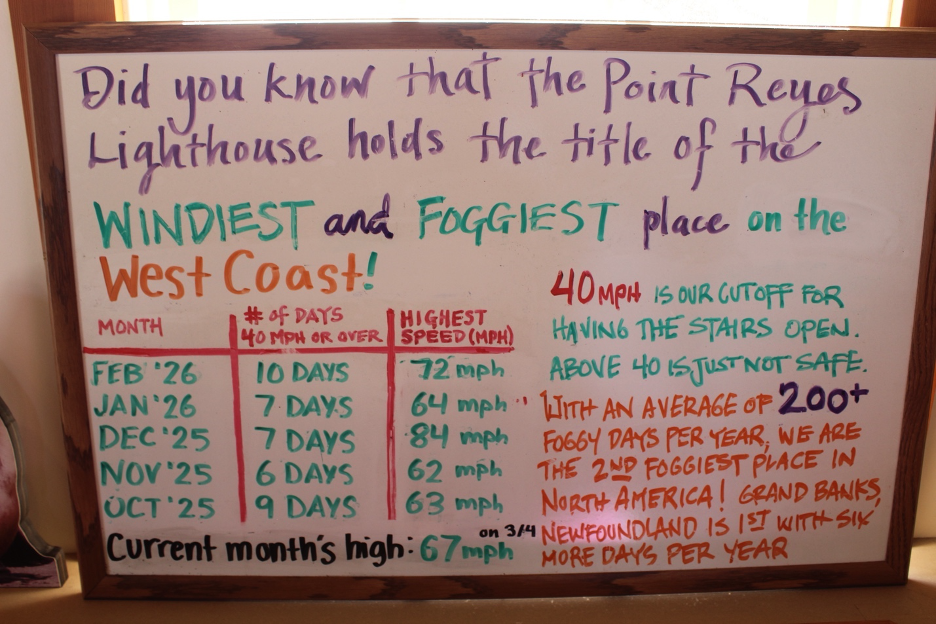
We expect cold fog or rain during March when visiting the Pt. Reyes Lighthouse, which is located on the very tip of land that jets out into the frigid Pacific Ocean and California Current. But the fog would burn off even here during this exceptional dry period that extended into the end of the traditional cool rainy season.
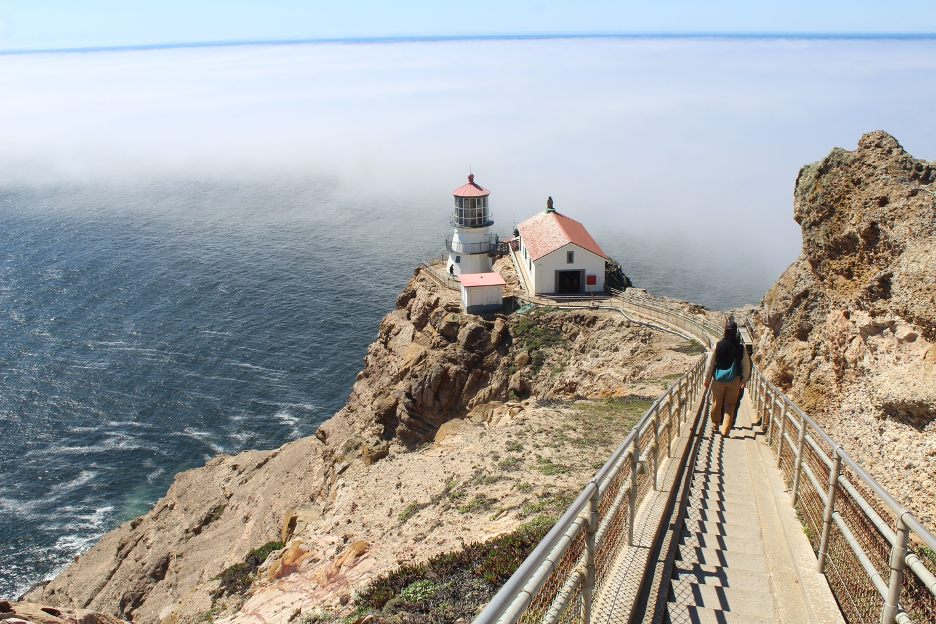
Morning fog eventually burned off even at Pt. Reyes on March 19, 2026, revealing acclaimed Northern California landmarks that included the Farallon Islands. We were even lucky to spot a mother gray whale and her calf meandering around the point during their seasonal migration north from Baja California back toward Alaska, in search of nutrient-rich waters. This was one small strip of coastline that wasn’t baking in the March heatwave, even when afternoon temperatures soared toward 90 °F in San Francisco, shattering heat records for the entire month.
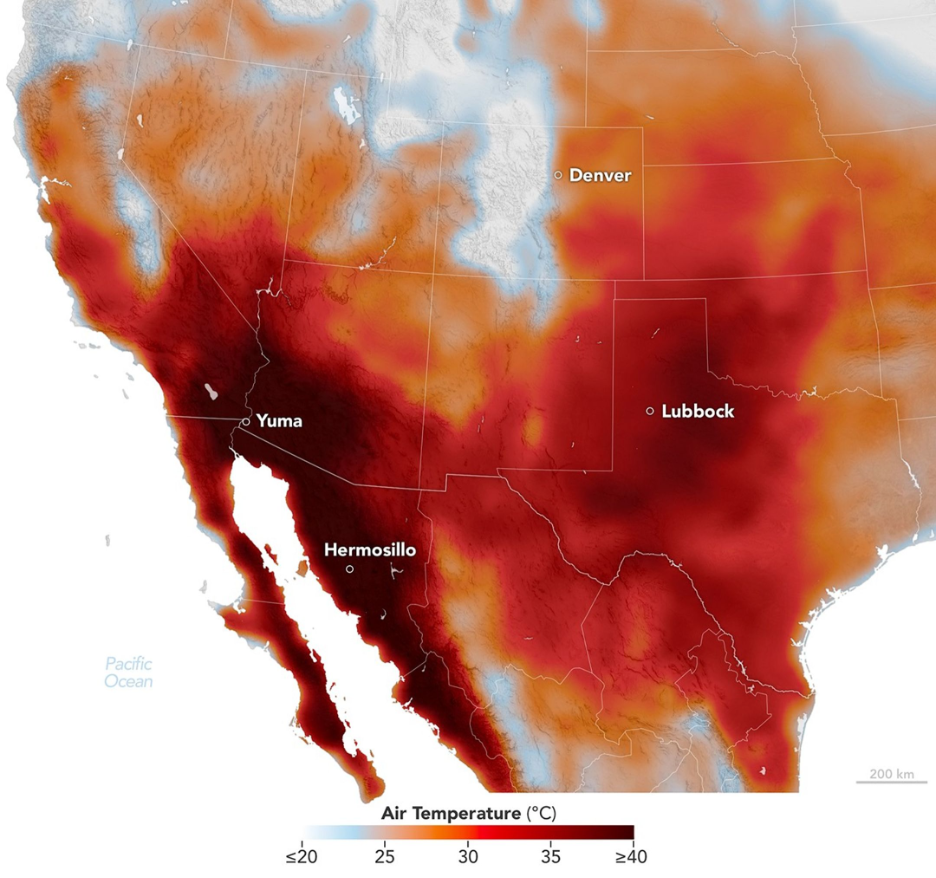
The extent of record heat (from Mexico to Northern California and the Great Plains) is illustrated on this March 20, 2026 map that shows actual air temperatures. Only the immediate coast and highest mountains are spared, though they were also experiencing their own high temperature records for March. This visualization is based on GEOS-FP data from NASA.
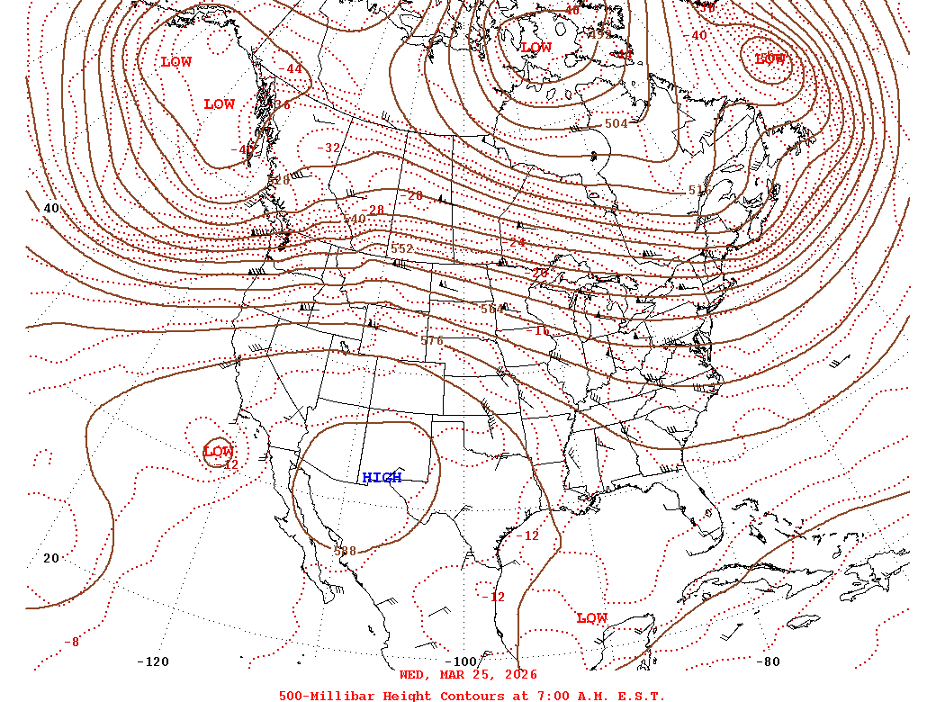
By March 25, 2026, the historic upper-level high pressure ridge (seen on this 500mb map) had finally started drifting east of California. By this time, the hottest March temperatures (over 110° F) in US history had been recorded in southeastern California and Southern Arizona. Recording stations throughout the southwest were the hottest they’d ever been so early in the season. You can see here how the heat dome drifted east, also shattering March heat records for Texas and the surrounding states. Source: National Centers for Environmental Prediction, Weather Prediction Center.
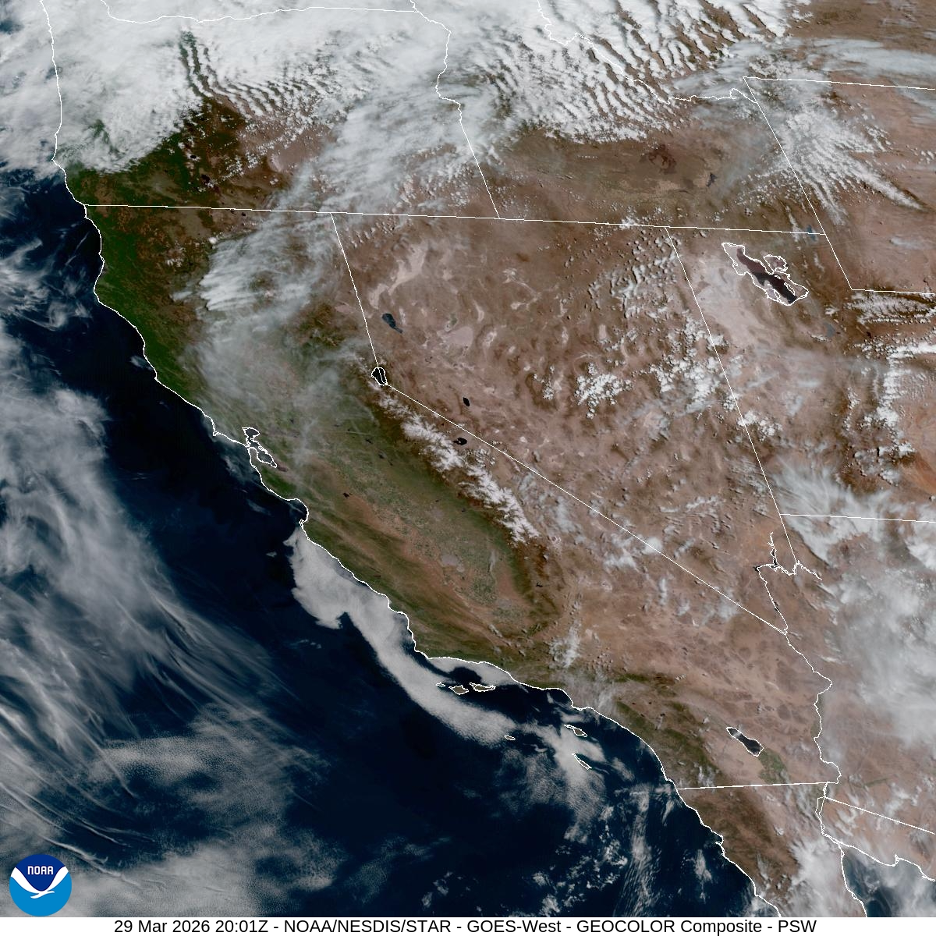
By March 29, 2026, what had been promising snowpacks in the Sierra Nevada and other western ranges had already melted into rivers and streams, leaving meager storage for the summer season. Those thin spotty patches of snow you see in the Sierra Nevada are symptoms of a growing water crisis across western states. On this day, the storm track remained far to the north again. But the historic high pressure was finally shifting east (until next time), allowing a few thin high clouds and some coastal fog to drift into view. Source: NOAA/National Weather Service.
Patches of the mysterious “blob” (see our discussion and images from earlier in the season) uncharacteristically persisted through March of 2026. How would these unusually warm sea surface temperatures impact our weather patterns into spring and summer? Adding to the suspense, by this date, another major game-changer was thrown into the list of variables that influence our wacky weather whiplash: Scientists anticipate a significant El Niño event is likely to develop in the eastern tropical Pacific in the coming months. Source: NOAA Integrated Ecosystem Assessment.
By April 1, 2026, many snow water equivalent measurements in the Sierra Nevada and across the West ranged from the lowest to 2nd lowest on record for the date. Though total seasonal precipitation was closer to average in several drainage basins, late winter mountain rains and record March heat waves combined to melt whatever snow had accumulated. These conditions match general climate change trends (with some short-term exceptions) during the last few decades, as predicted by climate models. Riparian ecosystems and our water projects (such as in the drought-stricken Colorado River Basin) depend on snowmelt from these snowpack water reservoirs that normally deliver precious water to natural habitats, farms, and cities well into the hot summer drought season.
Epilogue: Following the Science that Connects the Dots to our Future
This story’s roller-coaster ride analysis of interconnected phenomena guides us into 2026, as we hope to settle back into more seasonable expectations; but nature likely has other plans. If you want to imagine 2026 and beyond, click back to some of 2025’s extreme weather events, such as those analyzed in our other recent website stories (rogue storms, Texas flash floods, SoCal wildfires, etc.). What do they all have in common? Though we were warned a few days ahead by remarkably accurate forecasts from the National Weather Service, the deadly catastrophes went on to destroy too many lives and too much property, often because local officials failed to properly prepare and respond.
As a trough of low pressure sent drenching rains to flood California during the holiday season, the upper-level winds curved back north and over a massive high-pressure dome that anchored above the middle of the country. Record high temperatures over 80 degrees were experienced all the way up into the Great Plains in the days just before Christmas, with many locations recording their warmest Christmas ever. It was another example of how connected high-amplitude kinks in upper-level Rossby waves and jet streams can become stationary, creating prolonged periods of anomalous weather conditions. Those patterns would radically switch back and forth into 2026 to bring days of bitter arctic cold to the Midwest and East, followed by more extreme heat, and floods to the West, followed by record-setting March heat.
We have learned that anything goes as we anticipate beyond those seven- and ten-day forecasts, and the mysteries grow as we look further into the next year. So, we wonder why, at this critical time when we must better comprehend the science behind what is rocking our world, the US Government is cutting the heart out of the very scientific organizations that help us make sense of these changes and anticipate what might be next. As I write this, the latest victim to be thrown on the chopping block is the National Center for Atmospheric Research (NCAR) in Colorado. Should we lose this and other vital agencies that objectively and efficiently guide us through the science of change and warn us what to anticipate, we all become victims. What took us decades to build and nurture may be lost forever. Such short-sided penny-wise and pound-foolish irreversible policies are certain signs of a less developed society in decline, a culture that celebrates ignorance only to suffer the long-term consequences.
We could be forgiven for behaving like the frogs in the pot parable, except these are not gradual changes; they’re slapping our faces and kicking our butts every season. Changes that have always ruled our world have been growing in intensity and duration and these coalescing change agents are calling out for our immediate attention. Like uninvited intruders in our homes, such massive experiments are repeatedly and more frequently transforming our environments and our lives to remind us that we ignore them—and nature—at our peril.
Christmas Day storms eased just long enough to allow this rainbow to decorate the skies over Santa Monica Bay. Low-angle morning sunlight managed to peak through a break in the clouds so that it could shine into a rain shower headed toward the Santa Monica Mountains in the distance. (If you dare look for more, continue past the following brief list of links to find a chronological sequence of colorful images from space and the ground.)
For you dedicated weather enthusiasts and researchers who are hungry for even more discussion and details, continue on past this brief list of links, where you will find a chronological sequence of dynamic images from the last months and days of 2025. We then carry you through the next weather whiplash that delivered another record-breaking West Coast dry spell which coincided with the historic (and connected) cold waves of deadly ice and snow storms that froze the Midwest and East Coast through January 2026.
The series of warm, sunny days that followed early-season heavy rains produced a premature season surprise desert bloom (in January!) at places such as Anza Borrego. This story explores the mysteries behind Joshua Tree early bloomers at higher desert elevations.