More Detailed Analysis for Shameless Weather Devotees
A wealth of additional images (from the ground and from space) and maps follows, carrying you through some of the more memorable and dynamic weather events and colorful scenes from late 2025. Captions are limited, but they are also in chronological order. This journey (we could consider it an appendix or addendum) incudes some details that should interest meteorologists and climatologists AND instruct newer students and casual observers. We will make it all the way to the start of 2026 and a break in the stormy weather, ending our photo ops with sunsets, moon rises, flowers, and feathered friends. Finally, our January 2026 epilogue II (a necessary addition) displays images and weather maps showing how the West Coast suddenly dried out as the Midwest and East Coast were experiencing their epic prolonged cold snap. Such connected West Coast/East Coast opposites extremes would play out into February.
Revisiting Episode One (October-November, 2025): Odd Cutoff Lows Spin Their Moisture Magic
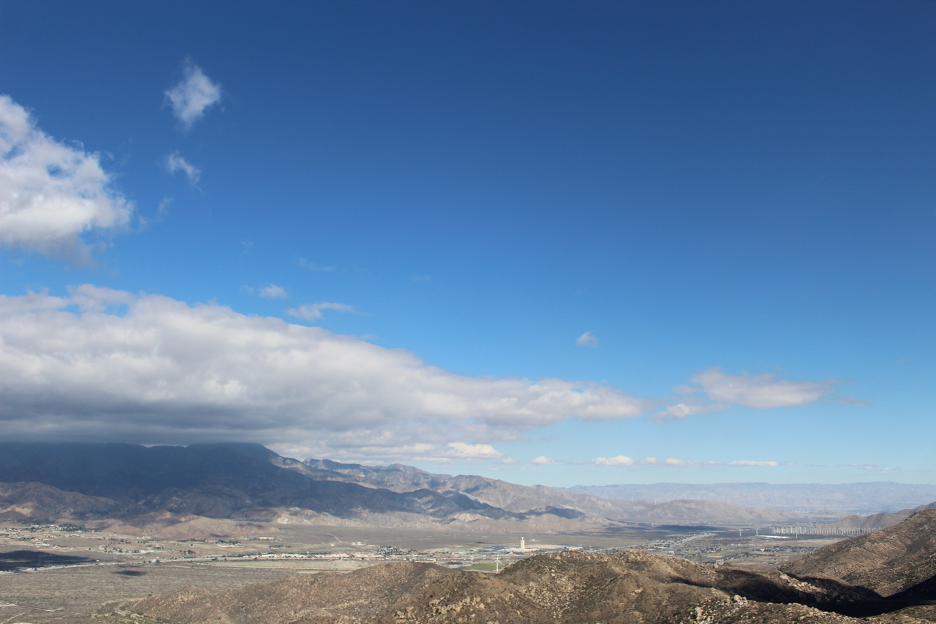
By October 15, 2025, an unusually early season rogue storm off the Pacific had already dumped inches of rain across California. Here, the storm had cleared San Gorgonio (Banning) Pass the following day, leaving some stratocumulus clouds behind. But this residual moisture wouldn’t make it to the dry rainshadow sides of the mountains or into the desert resorts beyond … on this day.
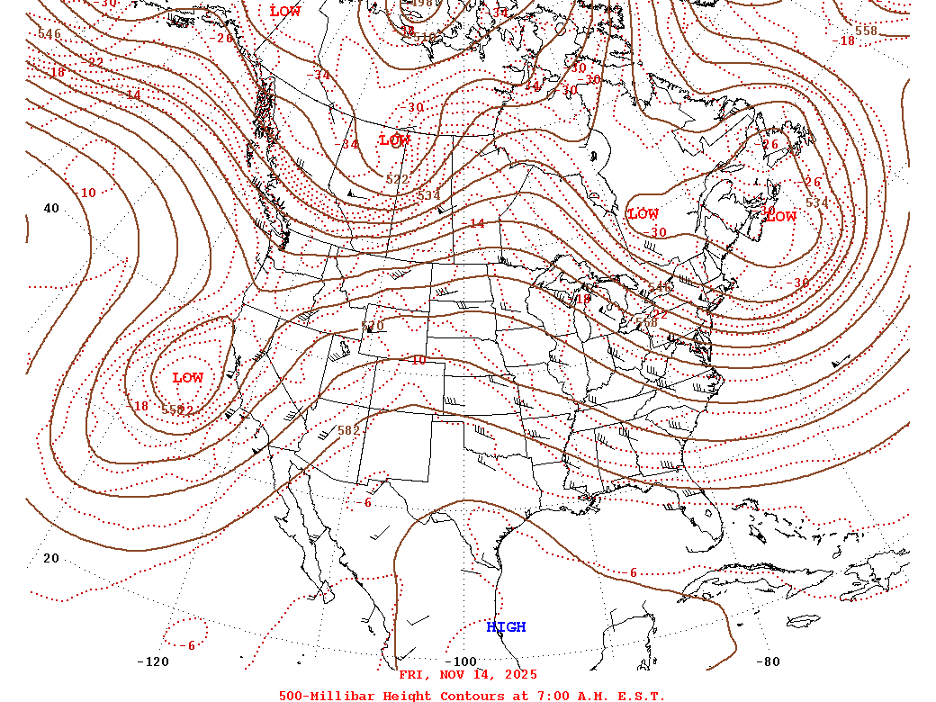
An early and unusually deep upper-level low-pressure trough guides wet middle latitude cyclones into California on November 14. In contrast, note the adjacent fair-weather high-pressure ridge over the middle of the continent. Source: National Centers for Environmental Prediction, Weather Prediction Center.
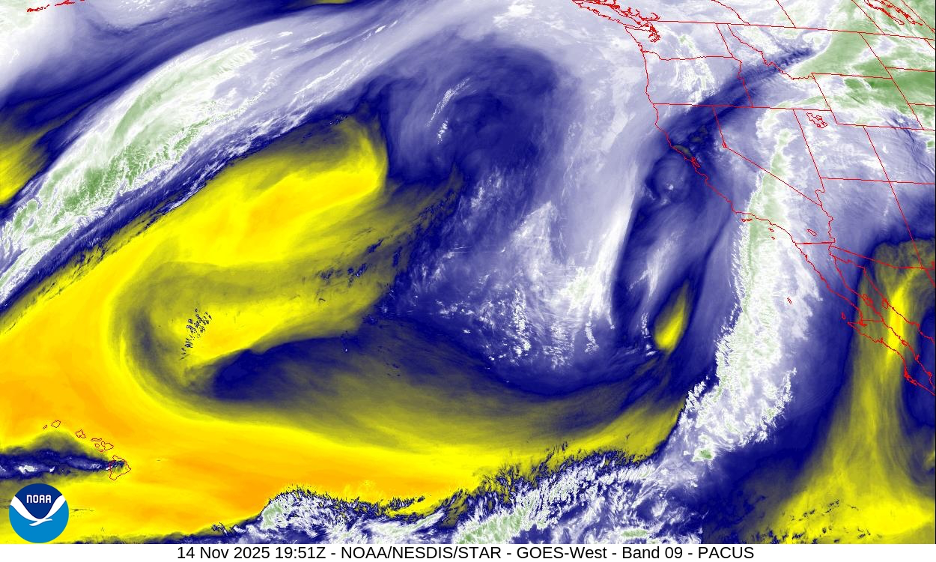
This water vapor image from November 14 shows a large trough off the California coast. That large elongated swirl just offshore is a gathering storm, guiding an atmospheric river. Source: NOAA/National Weather Service.
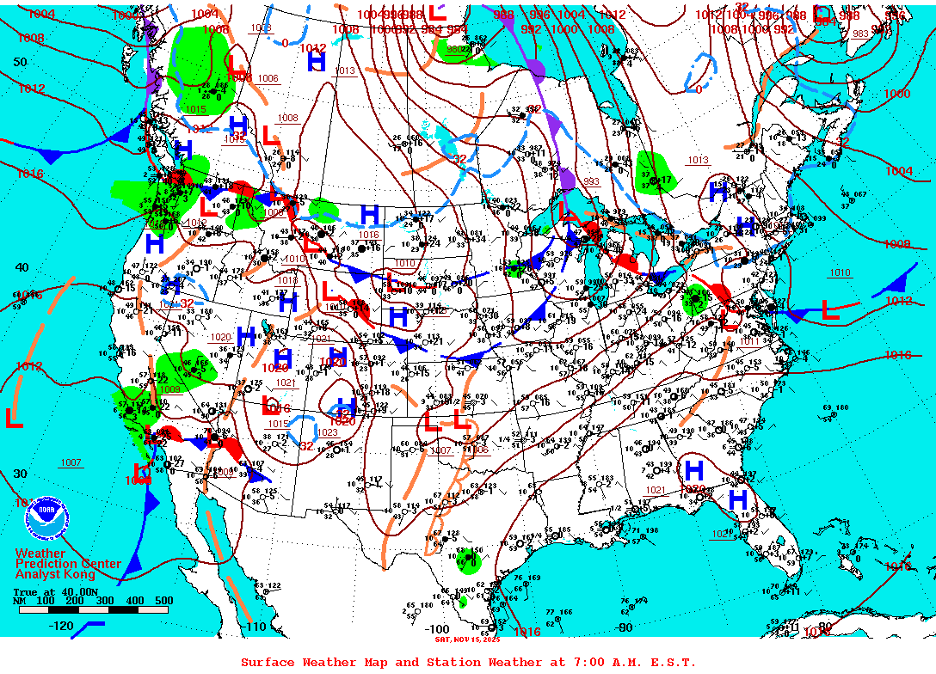
By November 15, the surface low was sweeping into Central and Southern California, carrying its weather fronts and confronting high pressure just to the east. Source: National Centers for Environmental Prediction, Weather Prediction Center.
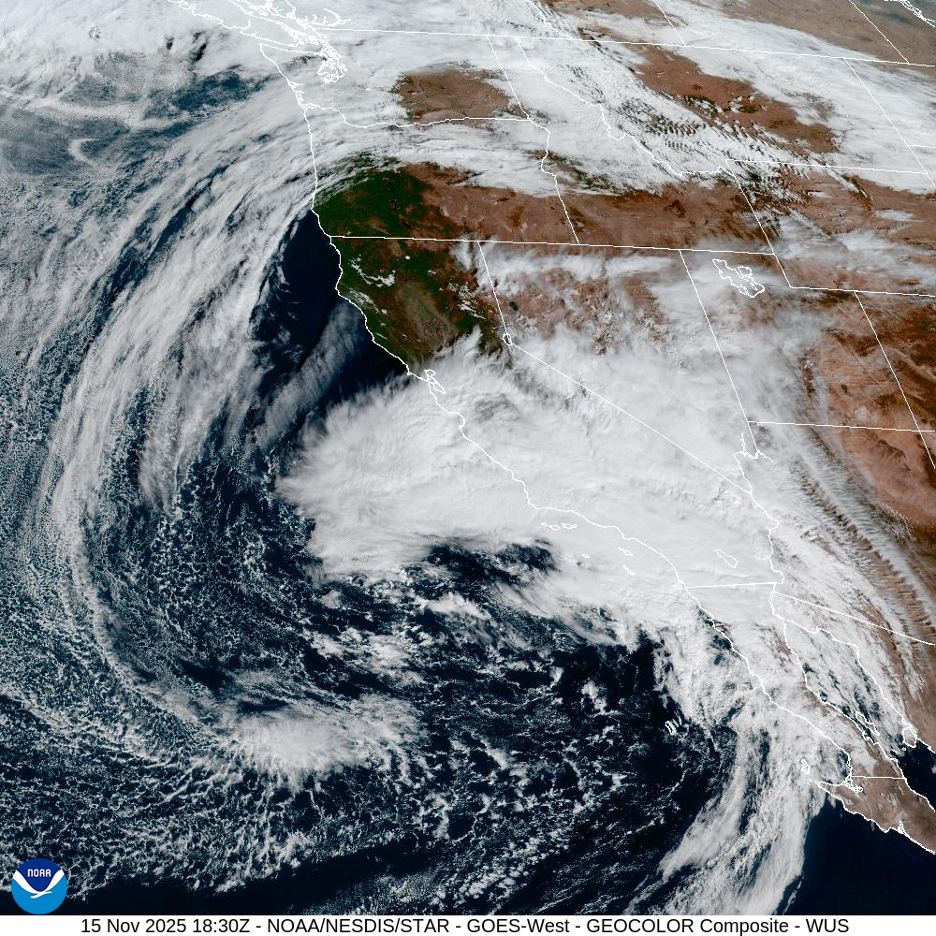
A surprisingly large and strong cyclone had formed by November 15, stalling and circulating moisture and instability just off the Southern California Bight. Source: NOAA/National Weather Service.
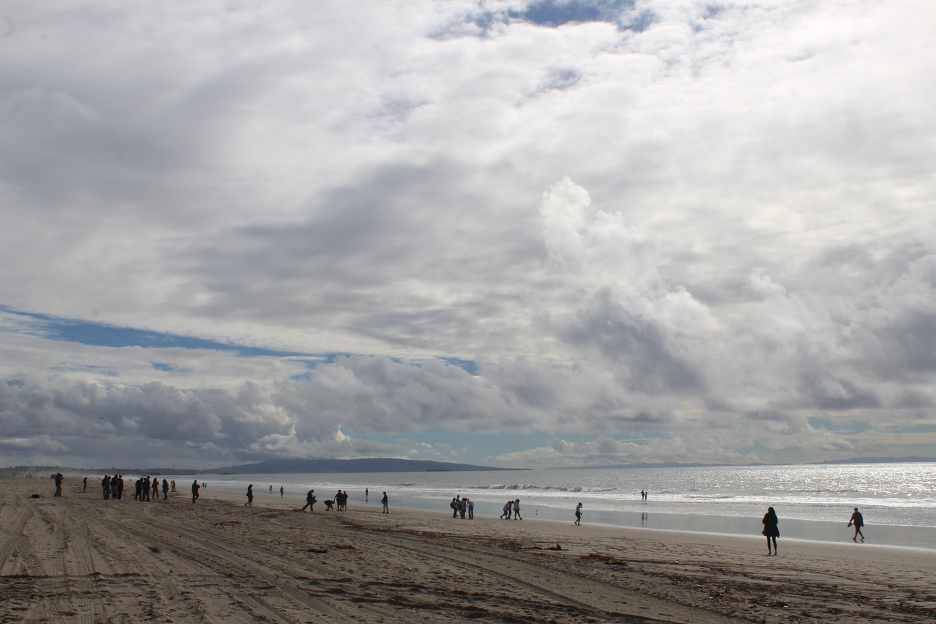
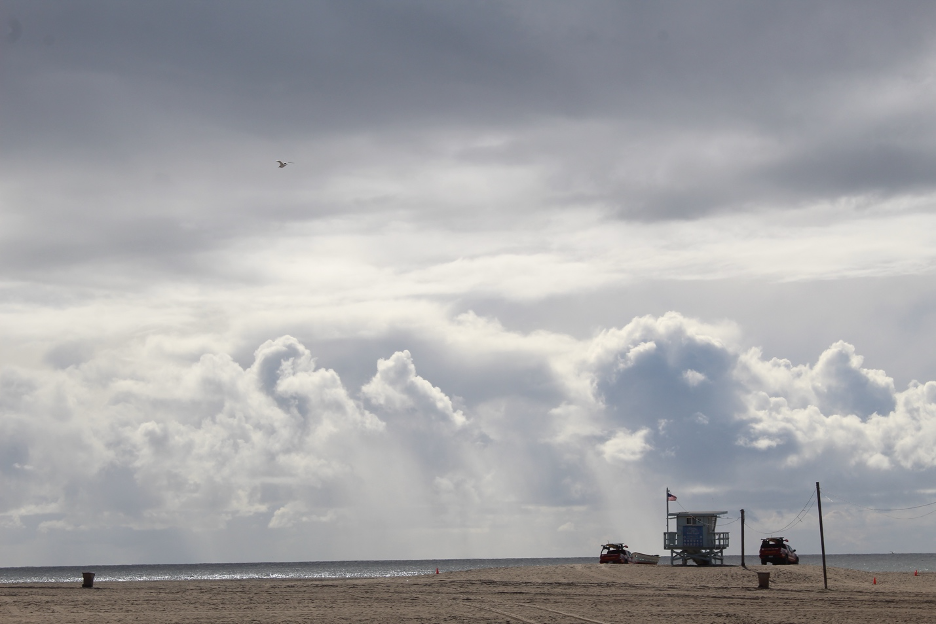
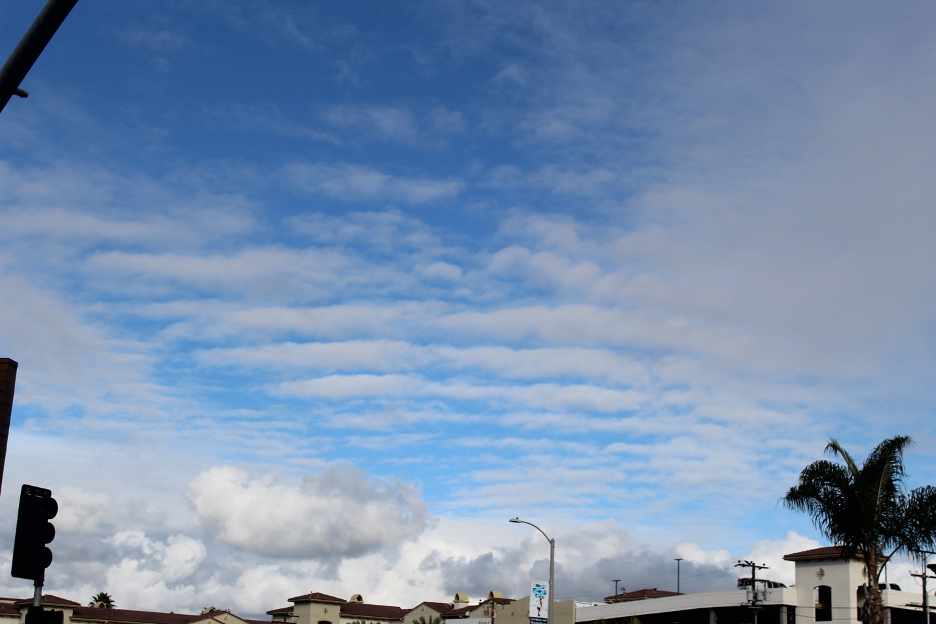
By November 16, much of Southern California was still under the influence of a giant wet low-pressure system, streaming a rich mixture of clouds over us. This is viewing south.
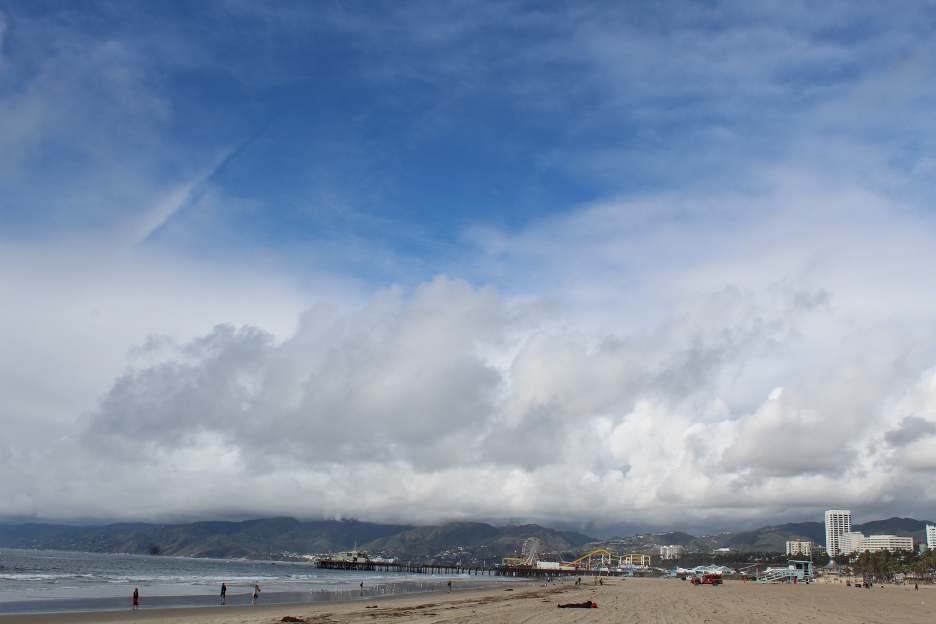
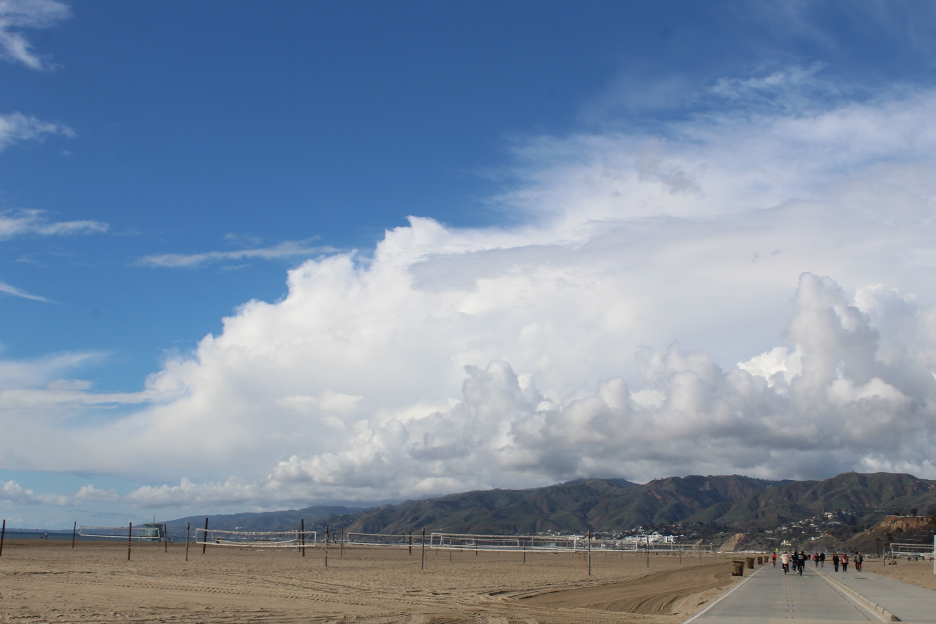
Also on November 16 (looking to the northwest), moist, conditionally unstable air masses must rise when they encounter the mountains. This lifting builds thicker clouds to produce orographic precipitation on the windward slopes and higher peaks.
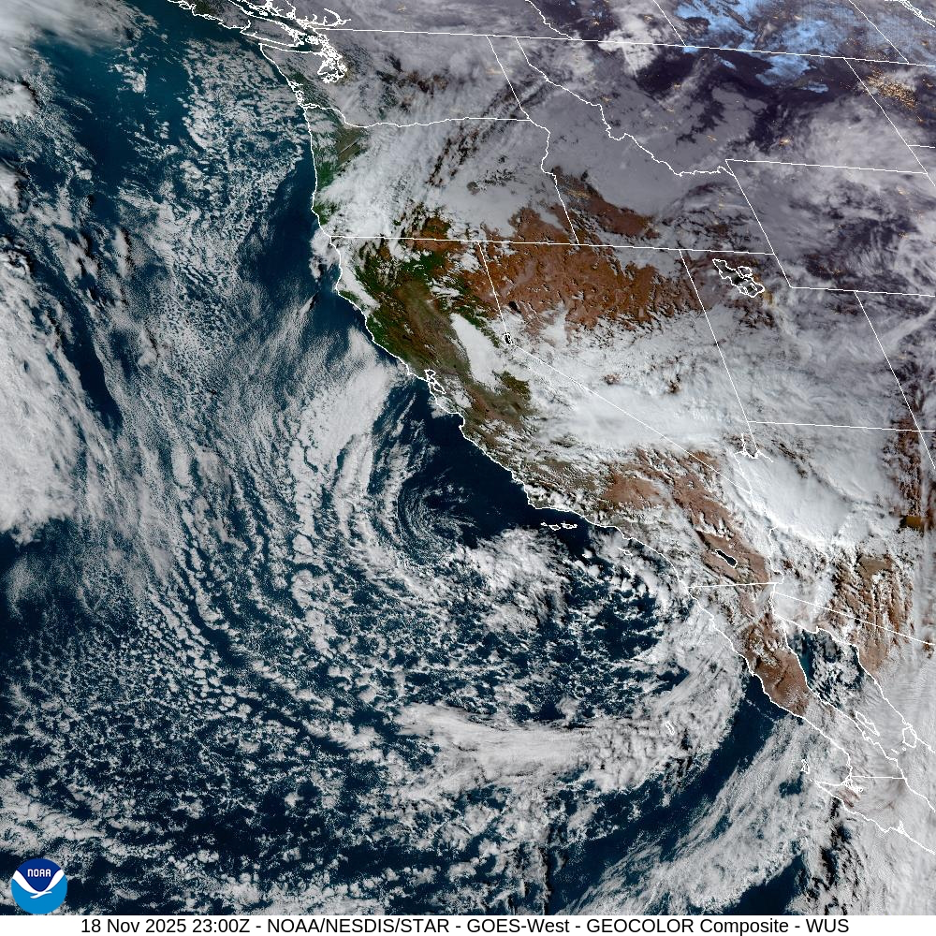
By November 18, the center of this large storm’s counterclockwise circulation can be seen near Pt. Conception. Source: NOAA/National Weather Service.
The air became unstable as the core of the closed low passed nearby on November 18. Rising air columns developed into icy towering cumulus to produce more showery weather.
As expected, the unstable air columns got another boost upward when they were forced to ascend over the mountains. Some towering cumulus clouds developed into cumulonimbus and thunderstorms farther inland.
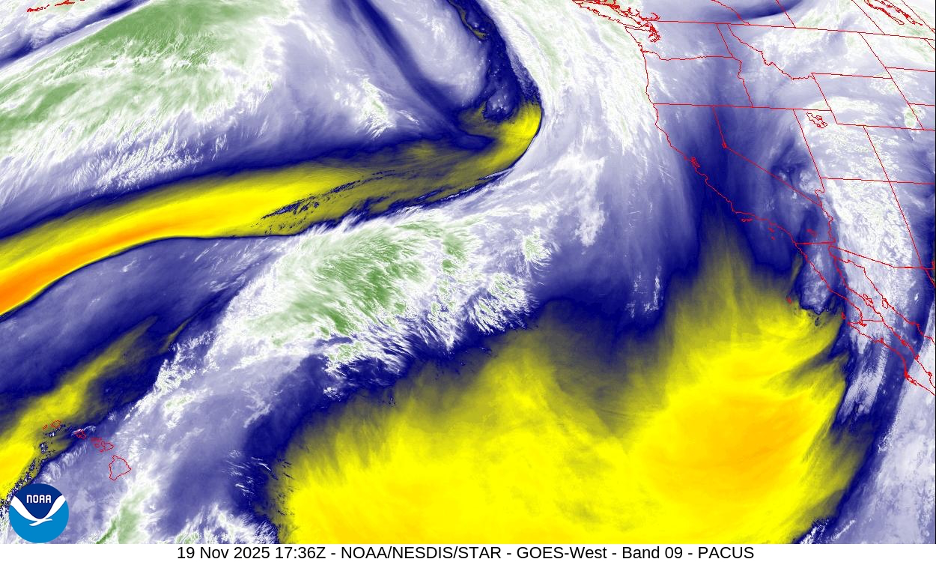
By November 19, one storm moved on east while another was forming with an AR to our west. Source: NOAA/National Weather Service.
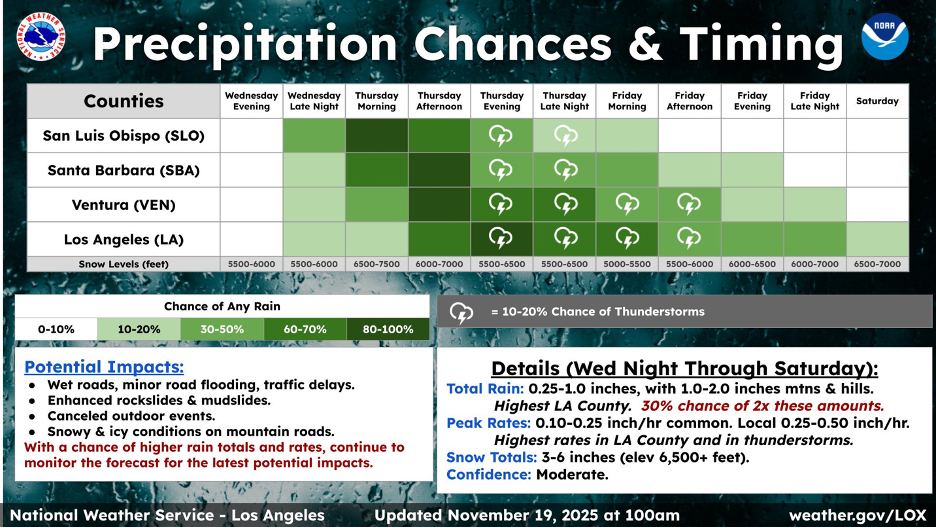
The National Weather Service used this graphic on November 19 to warn us that another unusually wet November storm was on the way. Source: NOAA/National Weather Service.
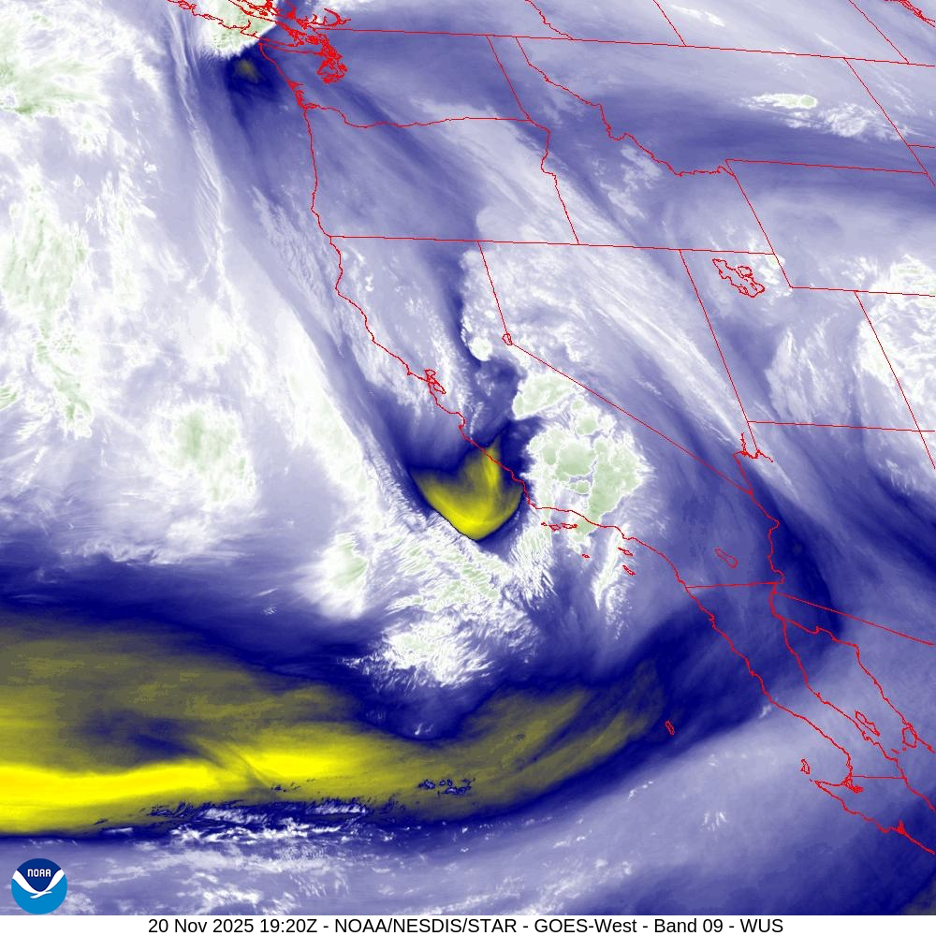
By November 20, this water vapor image showed another elongated low-pressure trough plunging south right off the coast. Source: NOAA/National Weather Service.
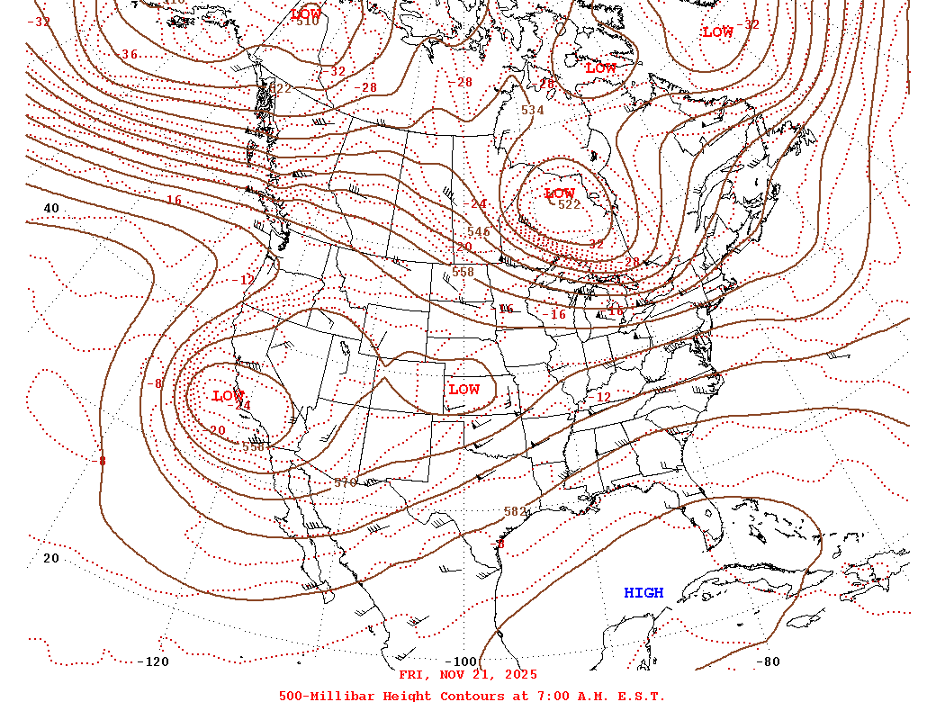
By November 21, the 500mb chart showed a closed low over California that looked similar to the one from just a week earlier. Source: National Centers for Environmental Prediction, Weather Prediction Center.
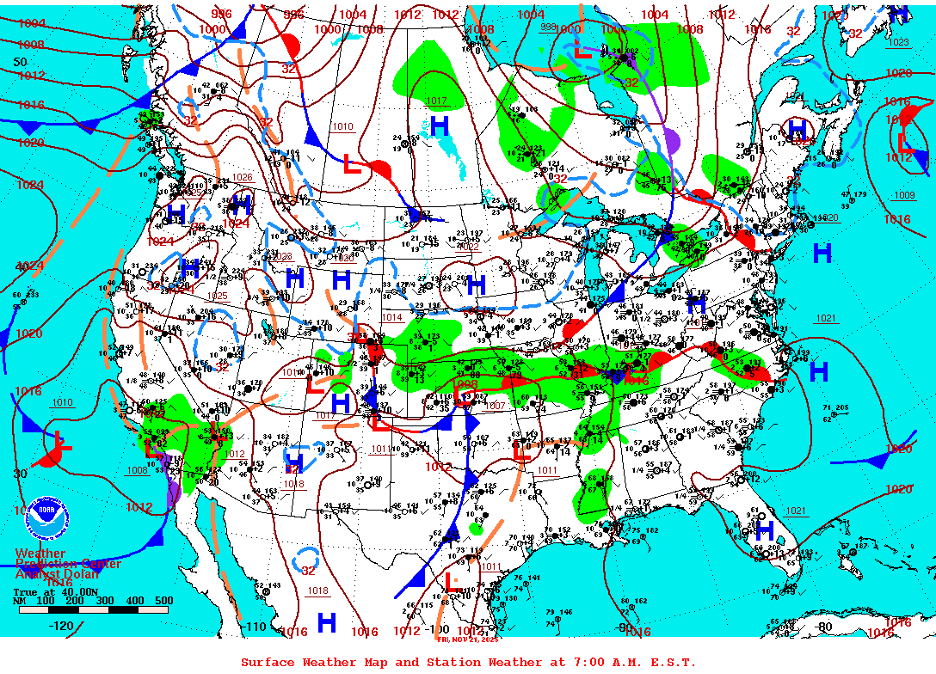
Even the surface weather map showed a storm sweeping into Southern California (Nov 21) that looked incredulously like the one from one week earlier. Source: National Centers for Environmental Prediction, Weather Prediction Center.
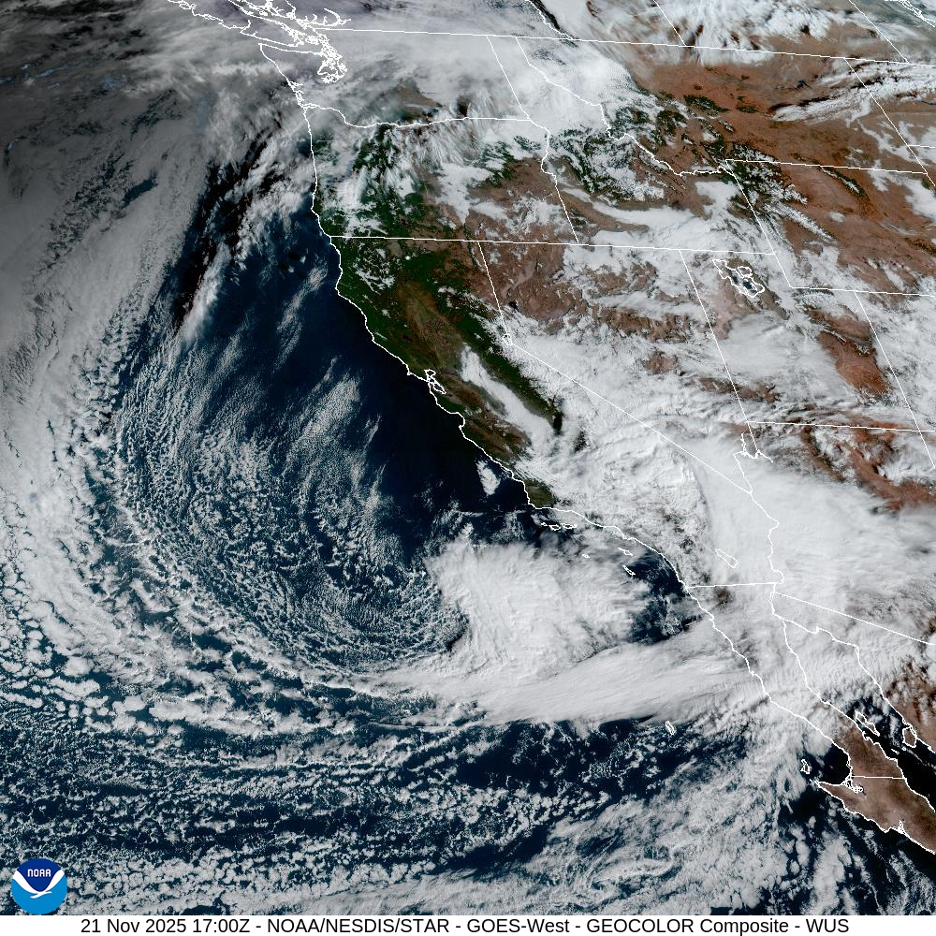
On November 21, another strong, wet impulse was aiming at the coast, following on the heels of the first wave of downpours that had passed to our east. Source: NOAA/National Weather Service.
The good news about being caught between storms on Nov 21 is that we got to admire the potpourri of clouds forming in the moist, unstable air.
Revisiting Episodes Two and Three (December 9-10): High Pressure, Dry Heat Versus Cold Fog AND Catastrophic Floods Versus Frigid East Coast Connections
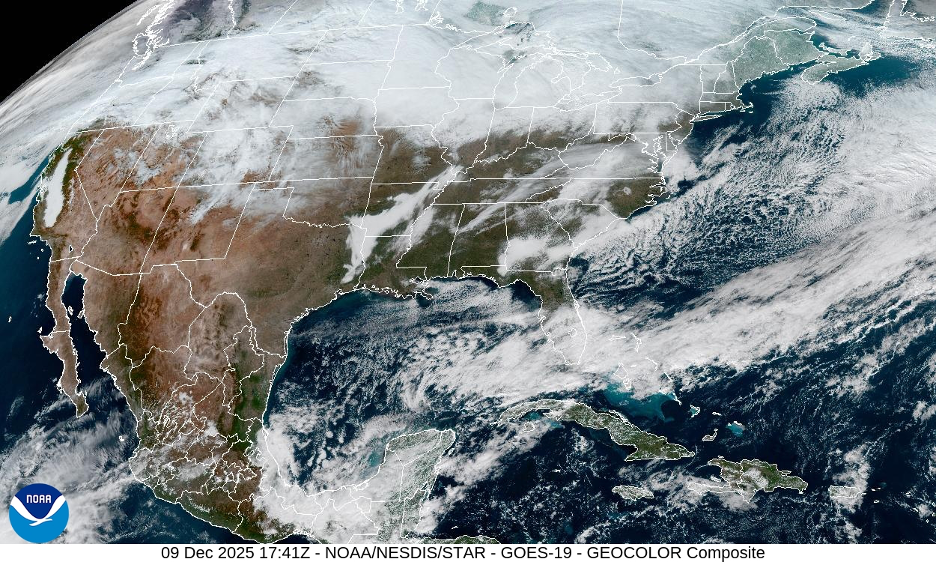
High pressure over the West steered warm ARs into the Pacific Northwest on December 9. As the upper-level winds raced toward the east, they dove back into a trough in the midsection of the country, directing extremely cold and stormy weather out of Canada all the way to the East Coast. Source: NOAA/National Weather Service.
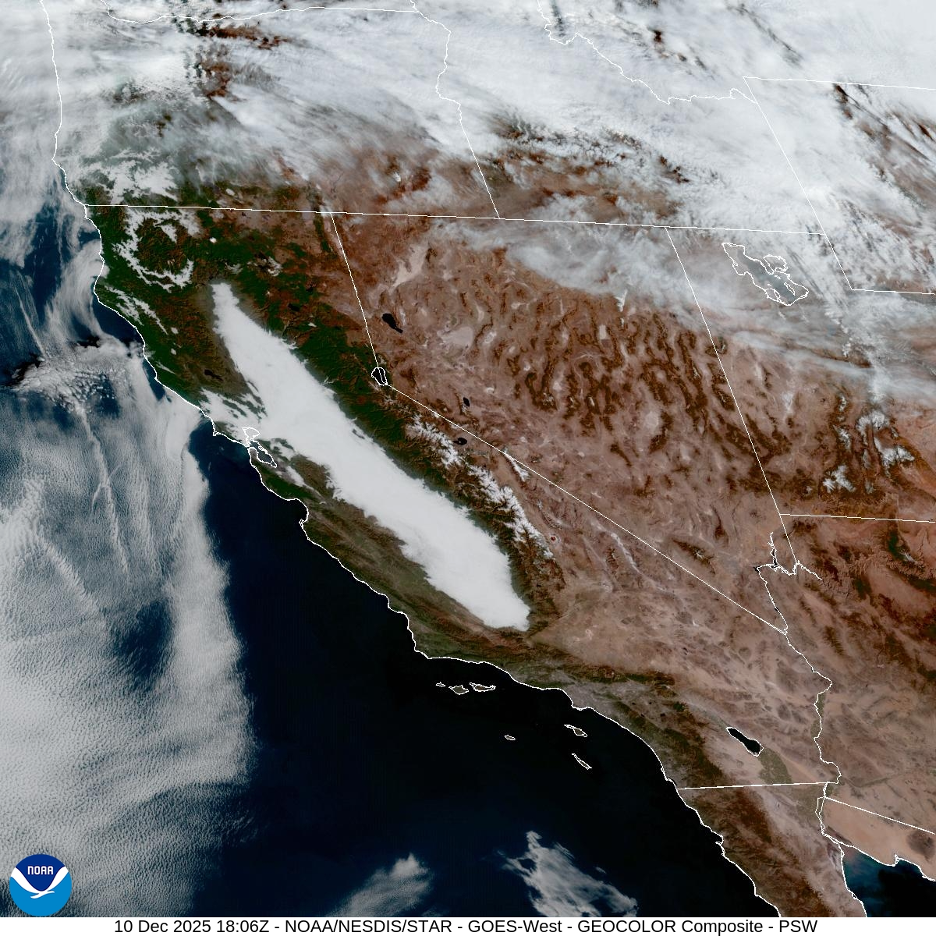
This is another view (on December 10) looking down through the stagnant high-pressure dome that orchestrated stable weather over California for nearly a month. Some snow is evident along Sierra Nevada ridges (the early storms were warm, bringing mostly rain), but the resilient shallow valley fog stands out as it creeps into the Bay Area and even into Northern California’s river valleys. Source: NOAA/National Weather Service.
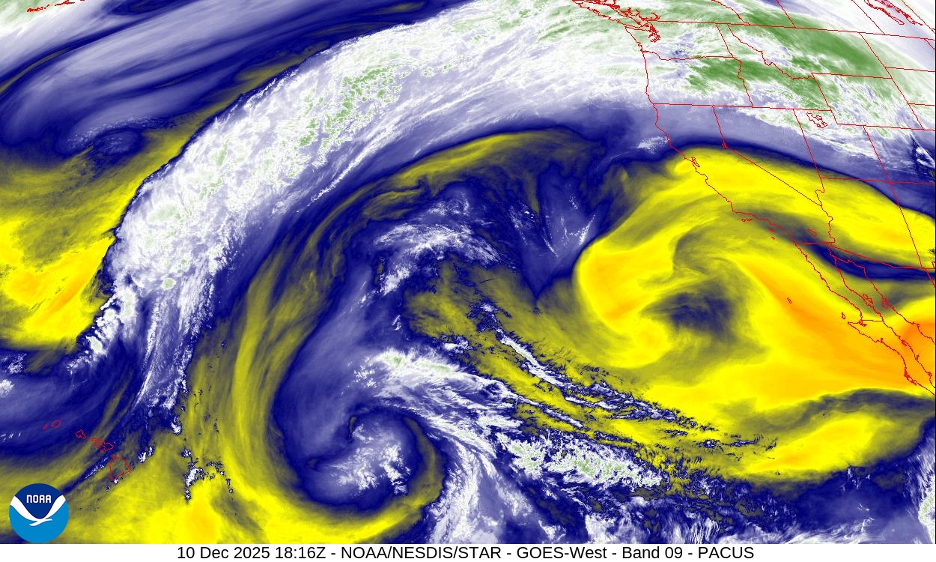
In this water vapor image (same date as the previous Dec 10 image), the yellow swirls signal very dry air and high pressure around Southern California extending into Northern California. But serious turbulence and big changes are brewing out in the Pacific. Source: NOAA/National Weather Service.
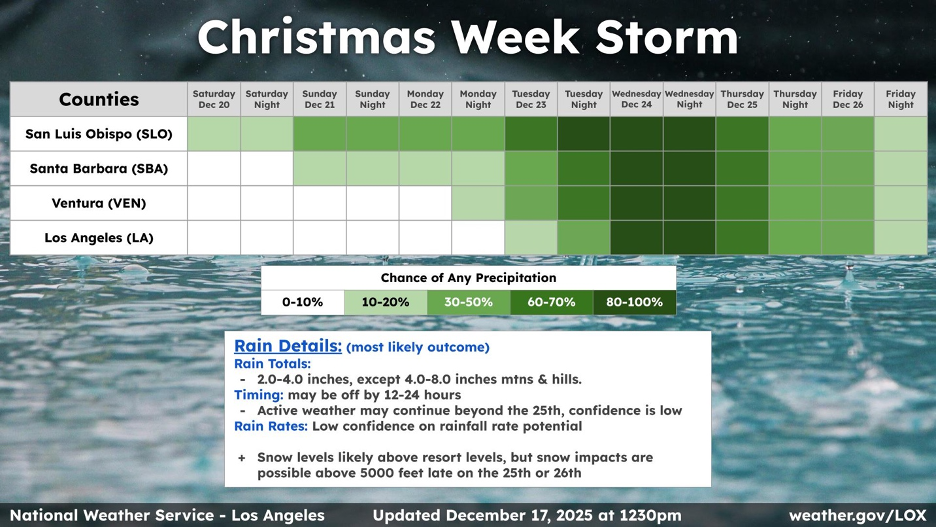
Revisiting Episode Four (December 20, 2025-early January, 2026): Atmospheric Rivers Bring More Winds of Change
Follow Us to the End-of-Story Bonus Colors: Rainbows, Trash, Cloud Murals, Sunset, Wetlands, Flowers, Birds, and the Return of El Sol.
The National Weather Service warned again about big changes in the days ahead and possible record-breaking holiday season storms. Source: NOAA/National Weather Service.
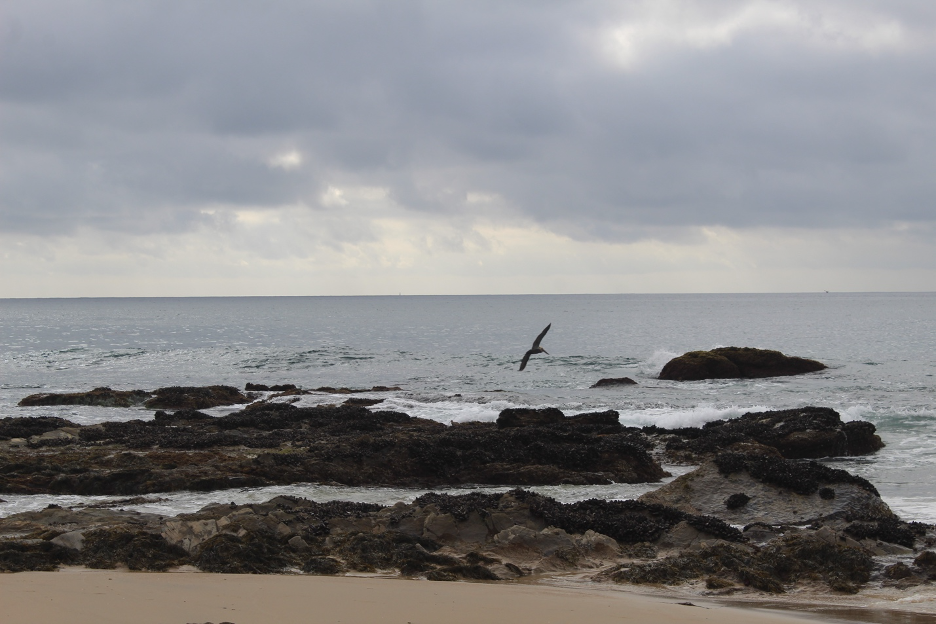
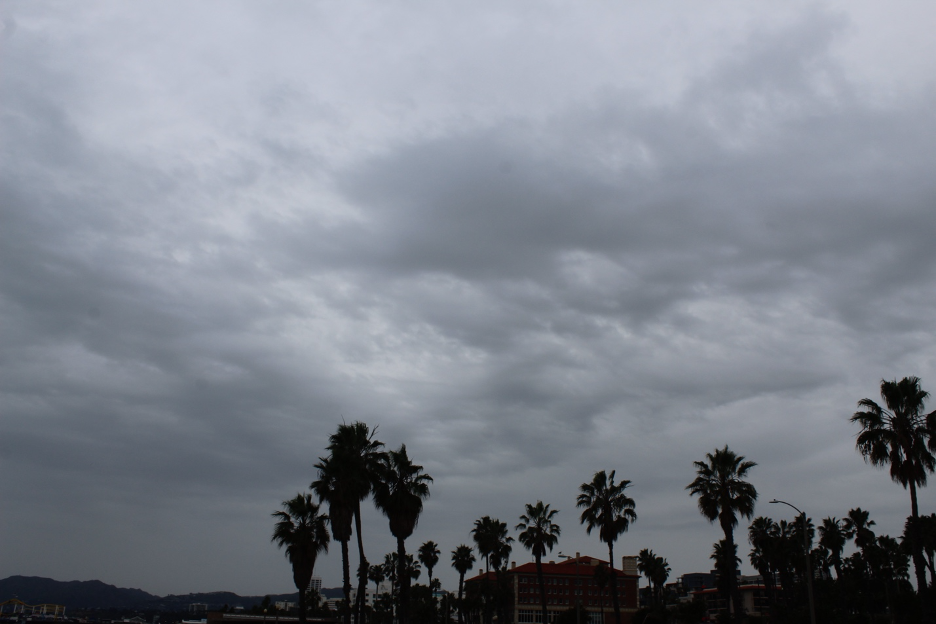
By December 20, pressures were dropping throughout California as a powerful atmospheric river began sliding south through the state. Do you think this bird sensed that thickening clouds along the Southern California coast were harbingers of a long, wet and wild holiday season?
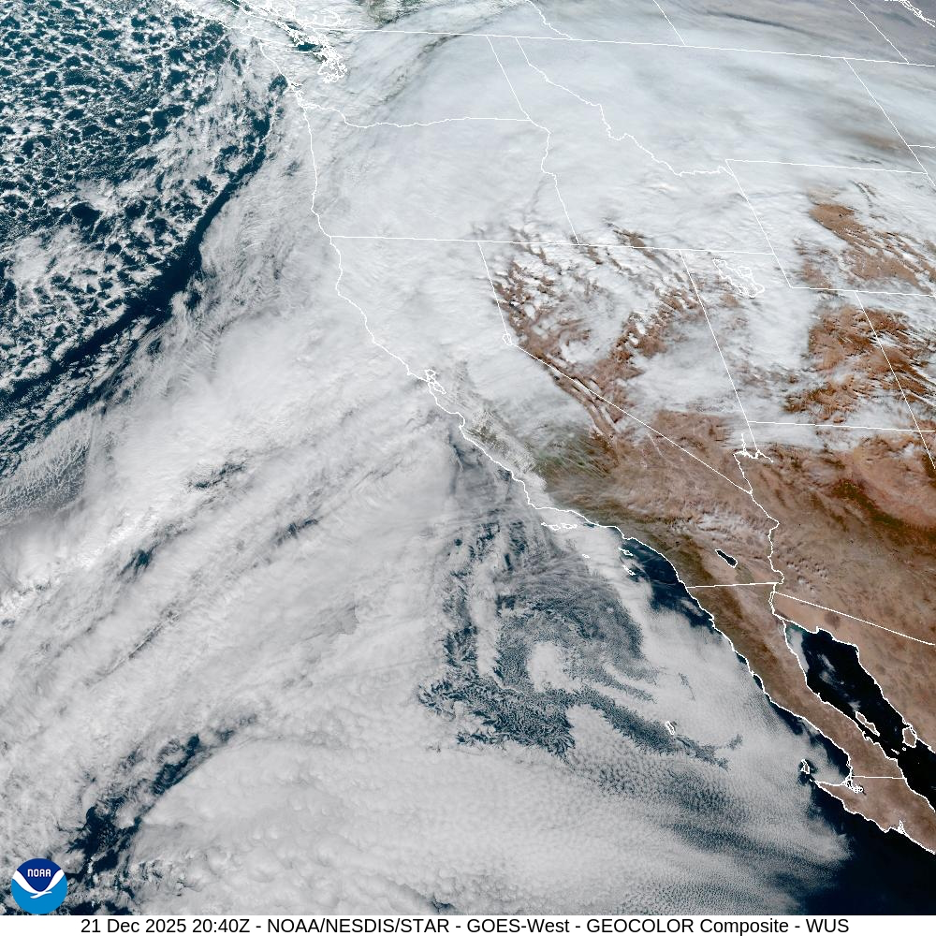
By December 21, Northern California was already getting drenched as the AR gradually pivoted south. Source: NOAA/National Weather Service.
By December 21, the AR firehose was flowing over the Bay Area, steered between the big low-pressure system circulating counterclockwise off the Pacific Northwest and high pressure just to our southeast. Source: NOAA/National Weather Service.
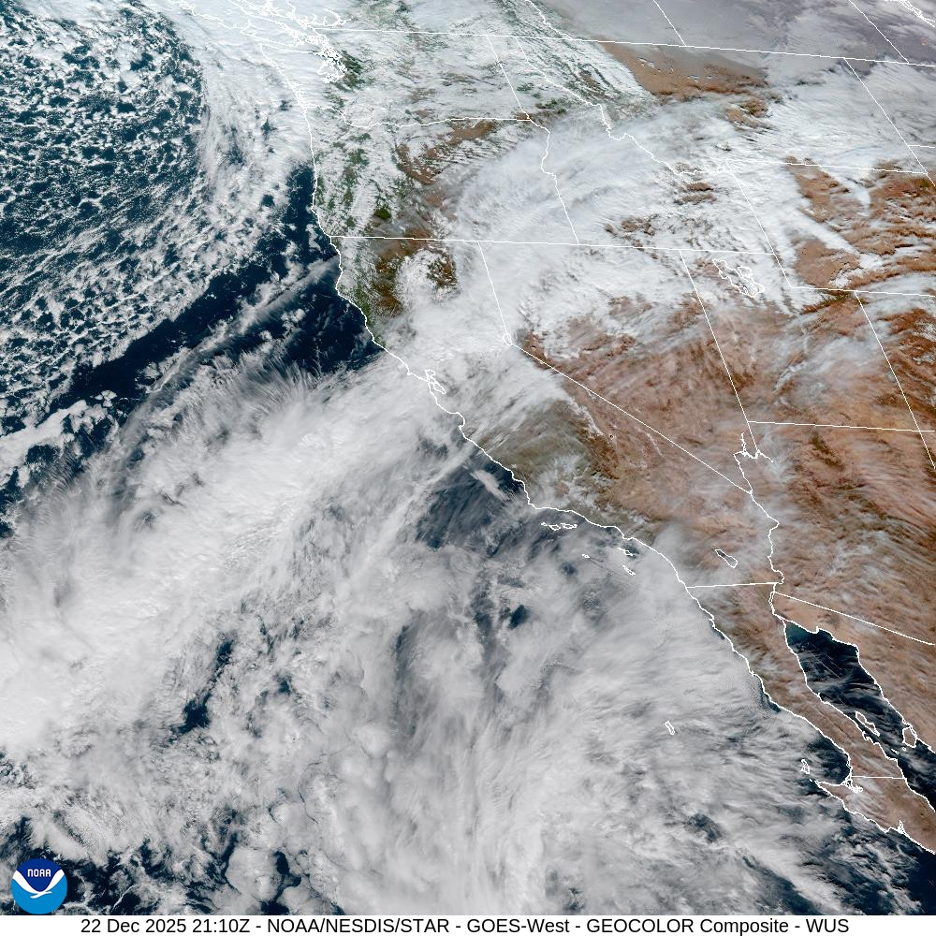
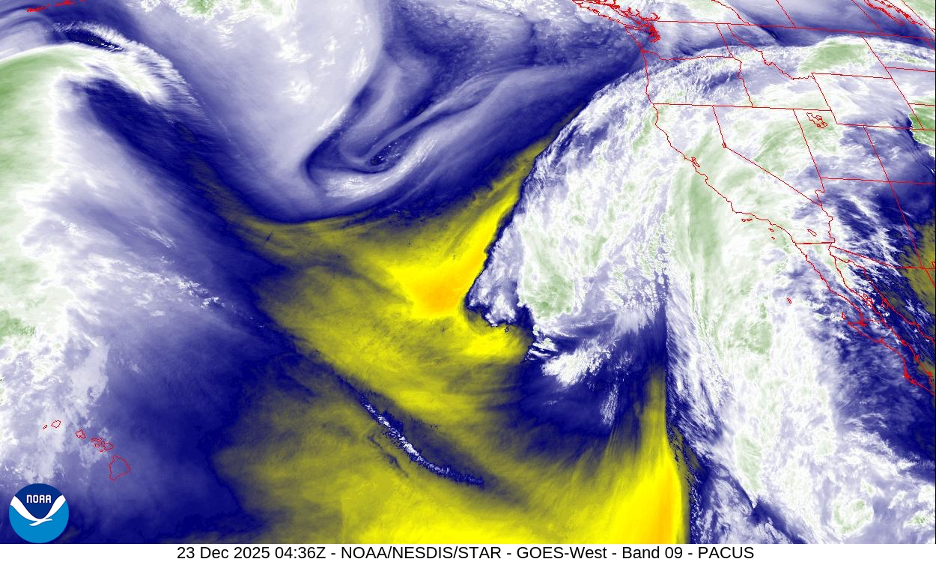
By December 23, the flow of moist air had pivoted to impact the entire state. Source: NOAA/National Weather Service.
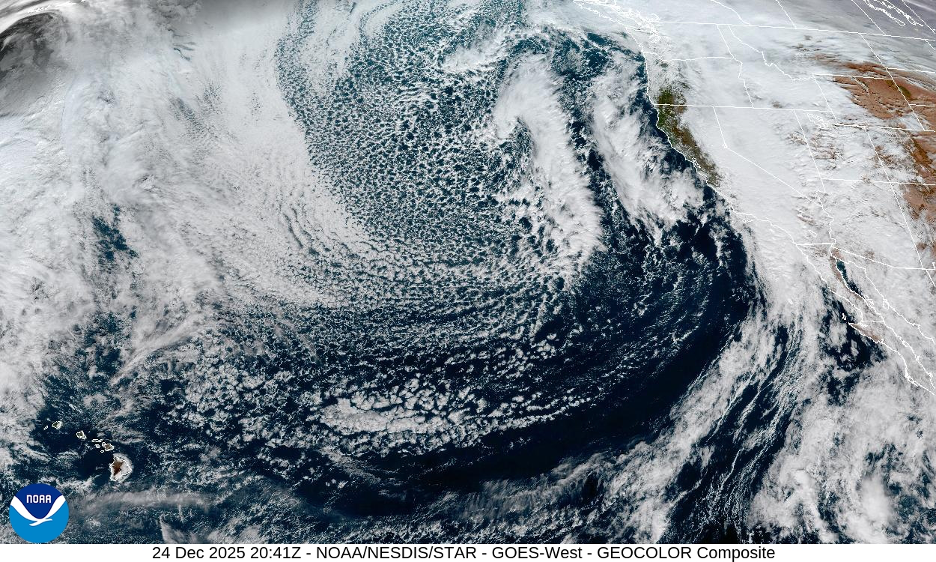
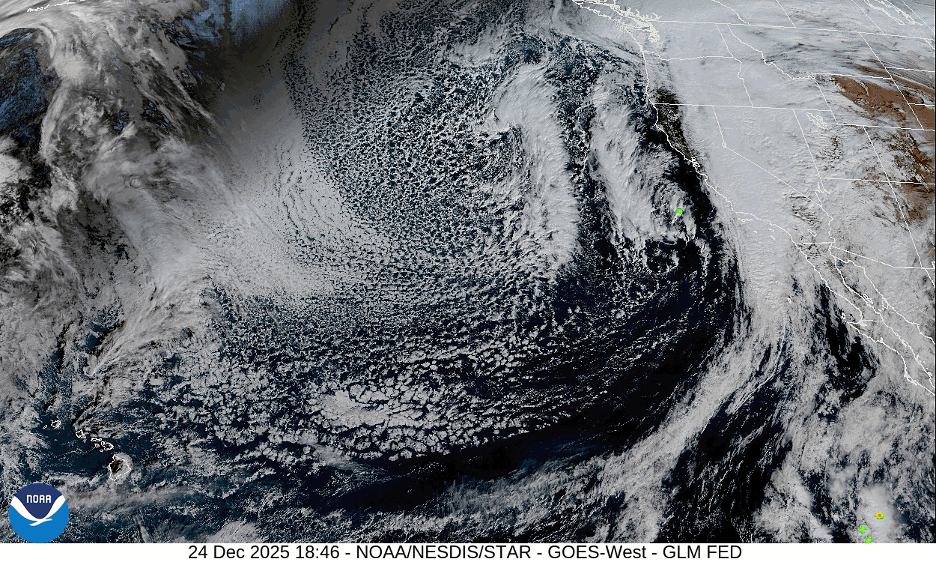
By December 24, a massive trough of low pressure just off the coast was directing a series of storms and ARs into the state. Source: NOAA/National Weather Service.
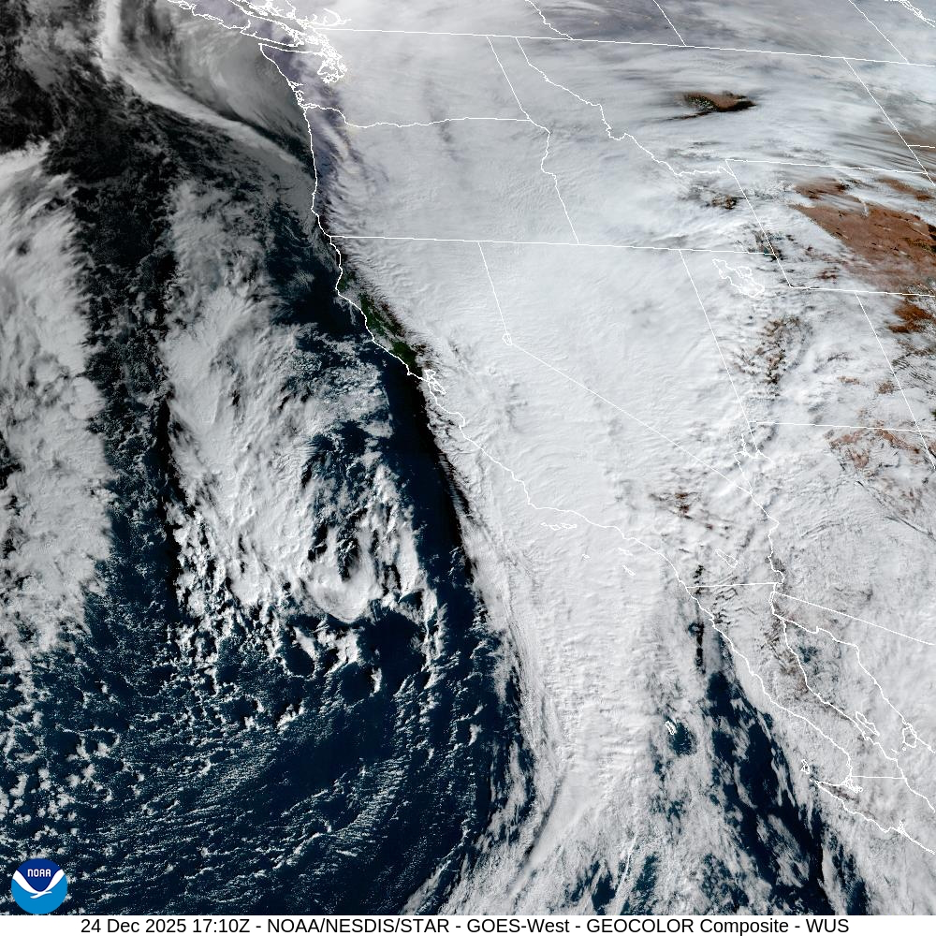
A closeup of the storm on December 24. Source: NOAA/National Weather Service.
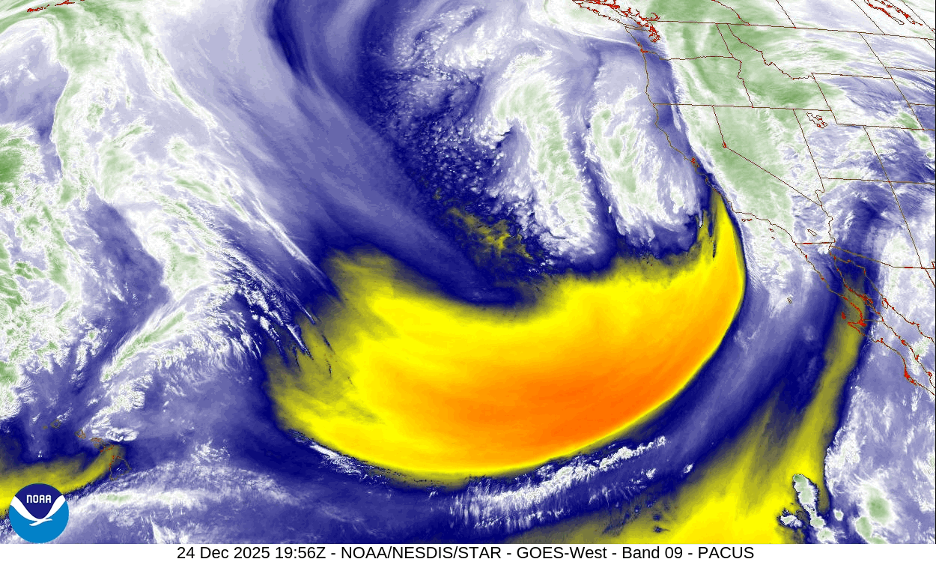
Run the water vapor image movie to view the dynamics of this wet system. Source: NOAA/National Weather Service.
This sequence displays the dynamics of this immense storm system. Source: NOAA/National Weather Service.
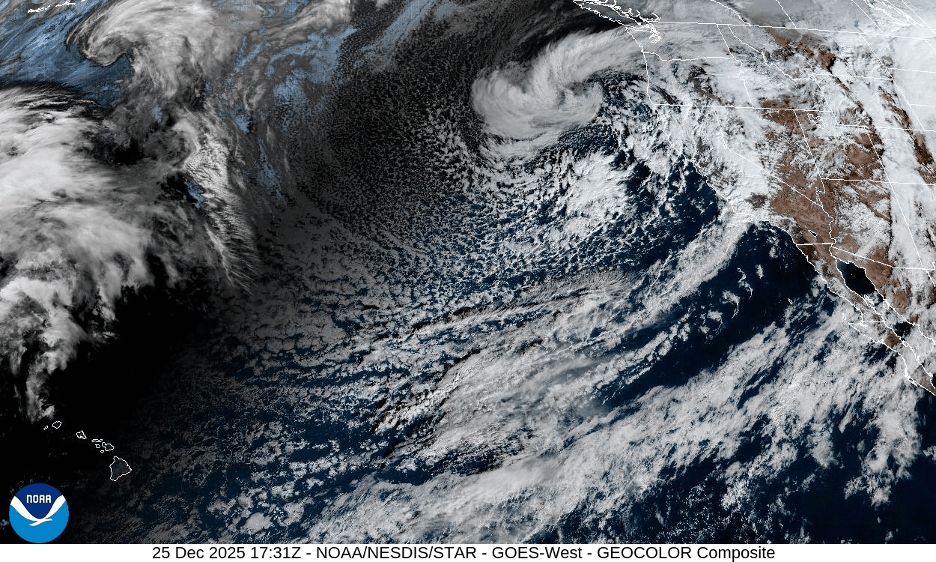
By December 25, several bands of rain (or impulses) were spinning around the trough and over the state. You can see the extent of this massive trough off the coast during this Christmas storm that broke some records. Source: NOAA/National Weather Service.
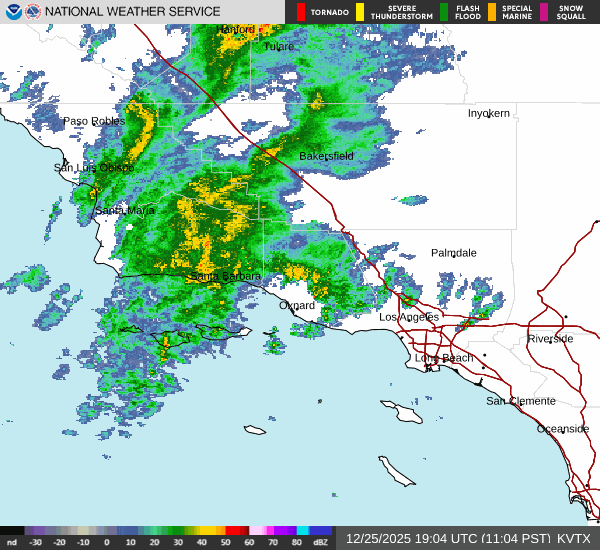
On Christmas Day, radar tracks a band of heavy rain that looks very familiar when atmospheric rivers slink along the coast. Trains of heavy showers bump against the Transverse Ranges, where they are lifted up south-facing slopes, resulting in extremely high rainfall totals. Expect extreme flooding when such ARs stall over one area. This is not a normal holiday for NWS forecasters. Source: NOAA/National Weather Service.
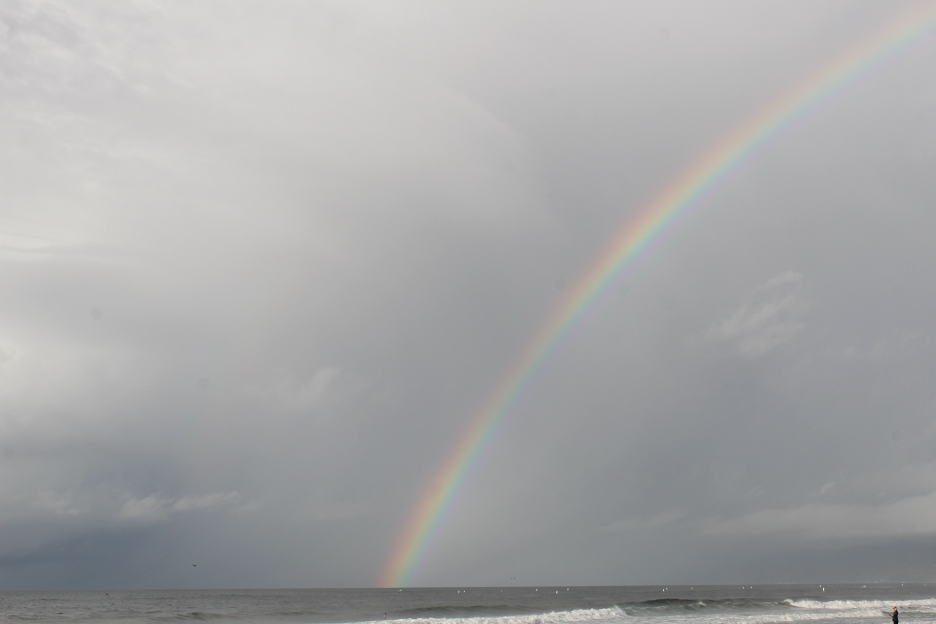
Here’s another view of this rainbow that formed below Christmas Day showers as the sun peeked through an opening in the clouds behind us. Sunlight is refracted when it enters millions of raindrops at an angle, reflected off the back of the drops, and refracted again as is comes out of the drops and returns toward our eyes. Such primary rainbows form at about 42 degrees from our line of sight. Since longer wavelengths near the red side of the spectrum are refracted at lesser angles and shorter wavelengths on the blue side of the spectrum are refracted at greater angles, the colors are separated into ROYGBIV.
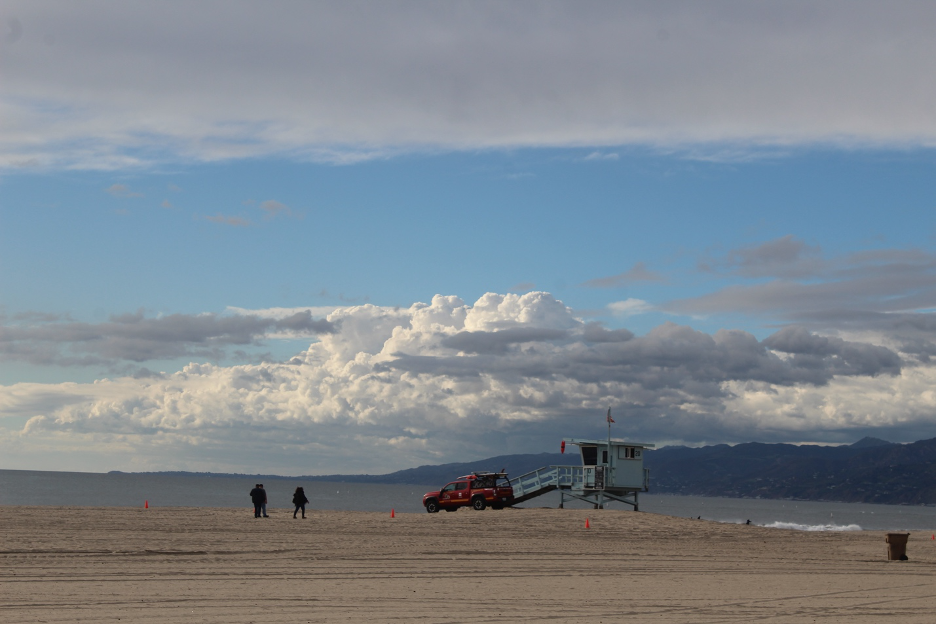
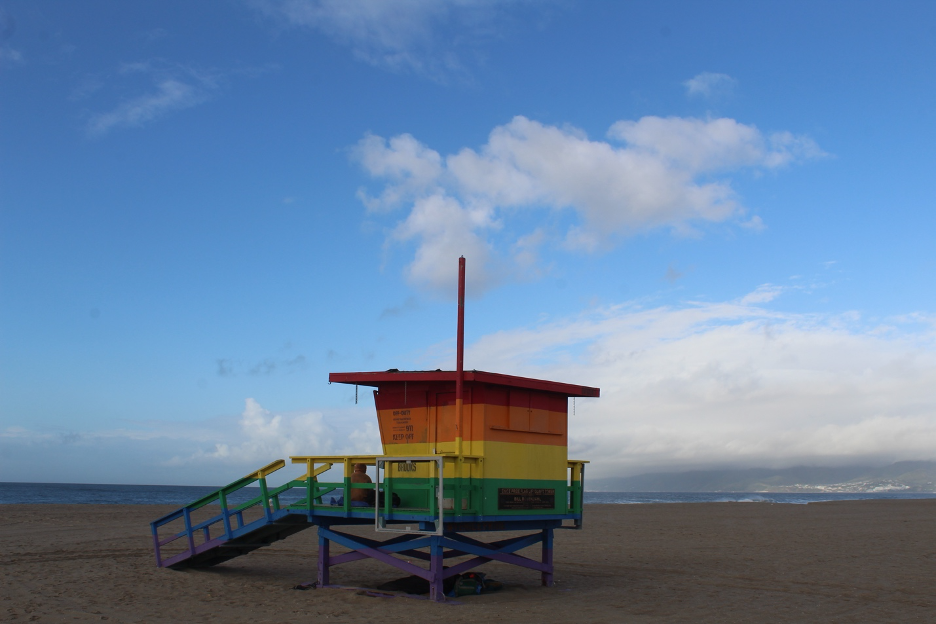
This rainbow lifeguard tower stood under a break in the storm on Venice Beach as if to mimic real rainbow colors in the previous image. The red, orange, yellow, green, blue, indigo, and violet (ROYGBIV) are painted in perfect rainbow order.
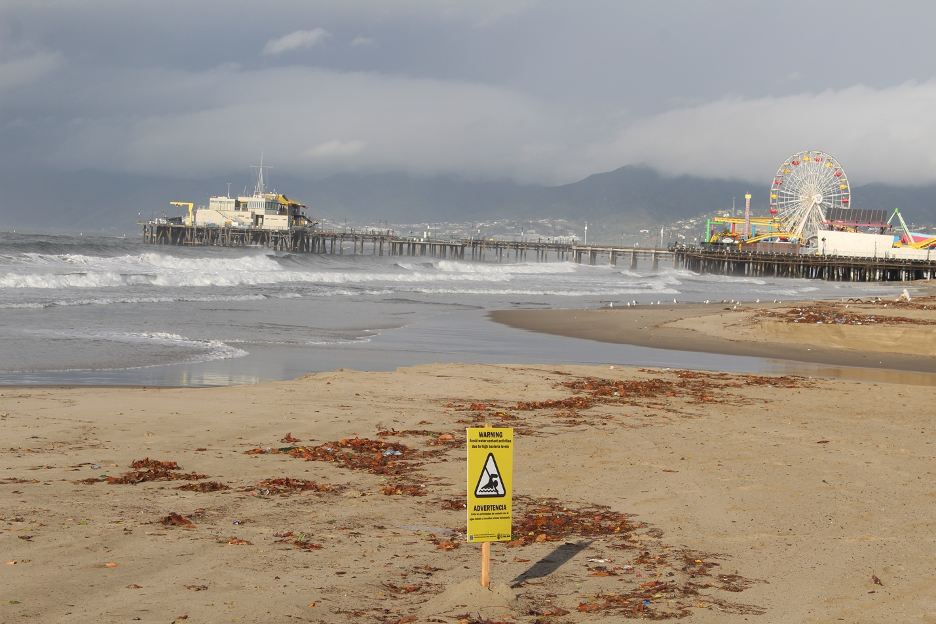
One negative consequence of these downpours is that they flush pollution off the streets and into the ocean. Swimmers and surfers are warned to stay out of the water for a few days until bacteria levels return to normal.
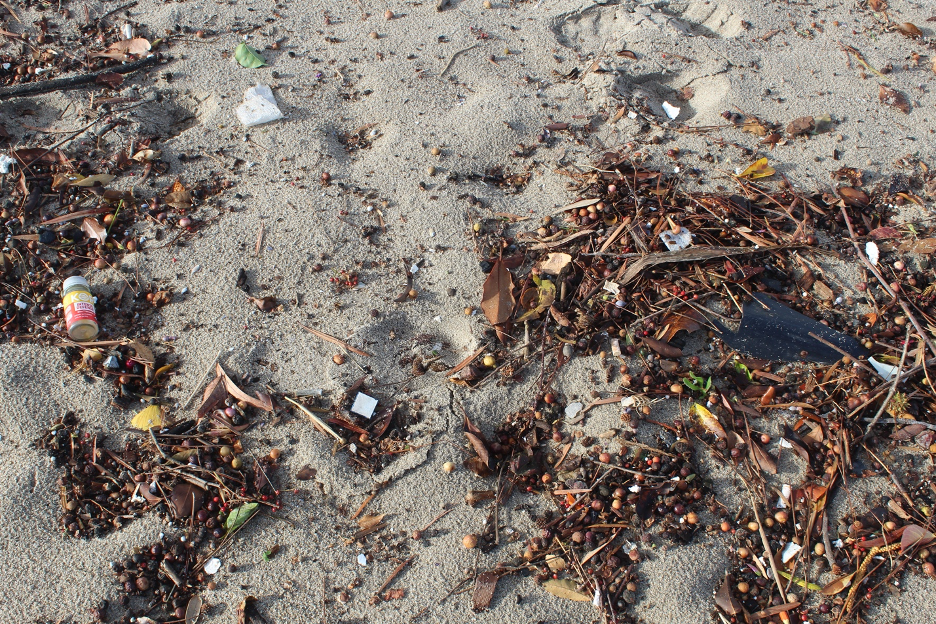
During heavy rains, the mix of plastics and other trash from our streets mixes with the debris flushed out from burn scars. Breaking surf and longshore currents eventually redistribute the mix down the coast.
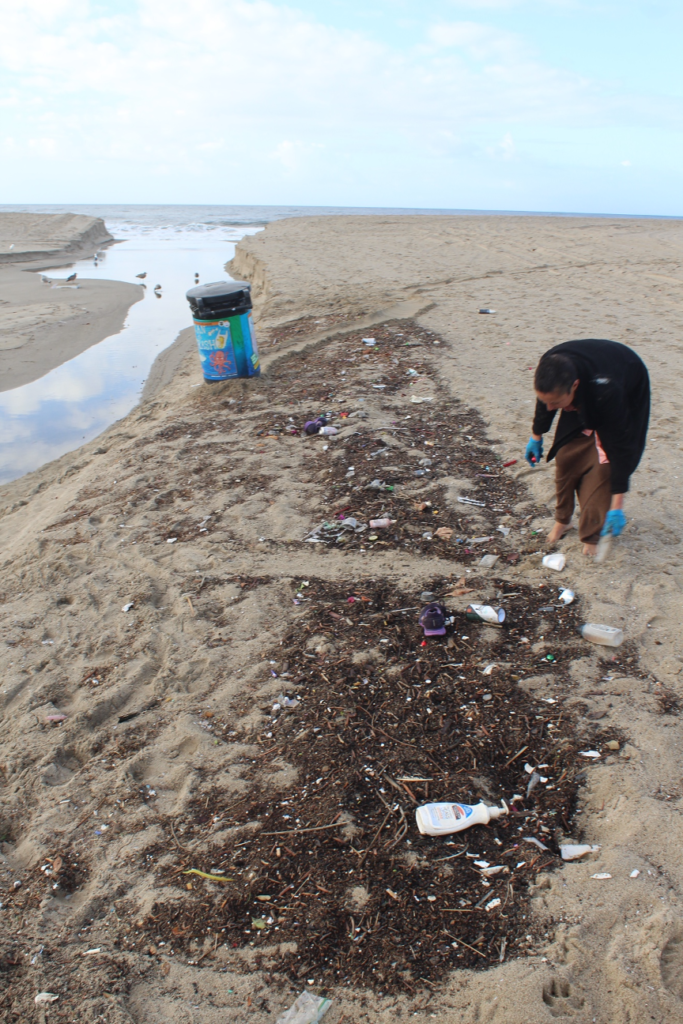
This concerned beachgoer is picking up plastics and other trash that were coughed out of this drainage during the storm. Notice the canyon that was cut into the sand as runoff rushed out to sea.
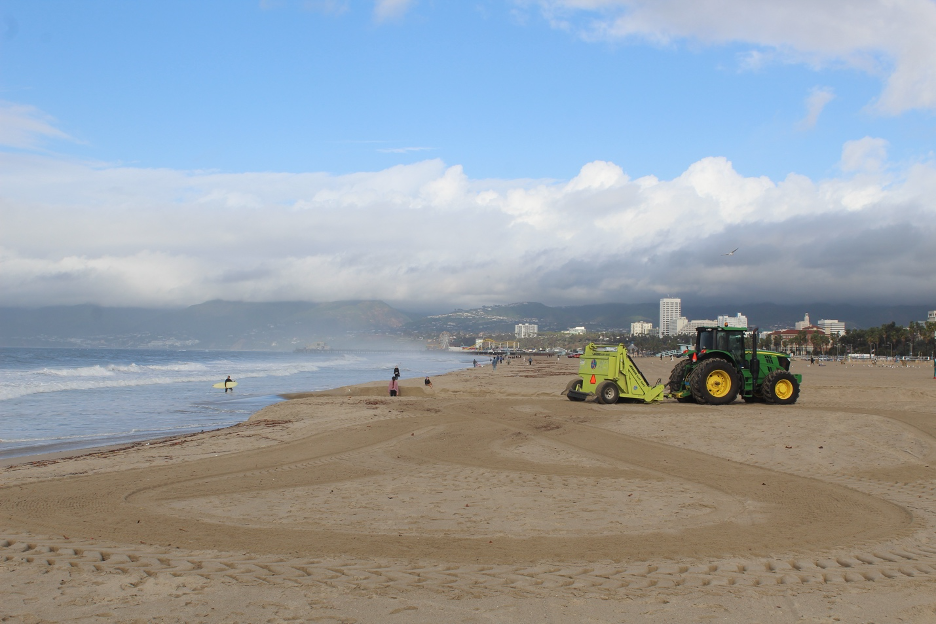
A worker and his tractor’s beach rake scooped up the debris deposited along the strand line before it could get carried out by the next high tide. A lone surfer dares to test bacteria levels after the storm.
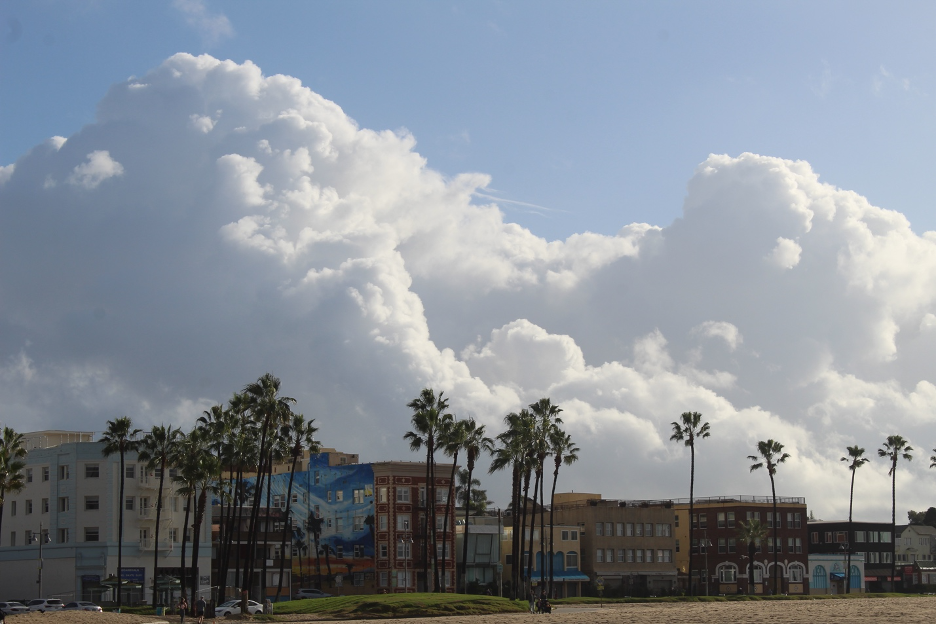
Cumulus cloud towers decorate the sky behind Venice Boardwalk during a break between Christmas rain showers. Look carefully for the mural featuring cumulus clouds!
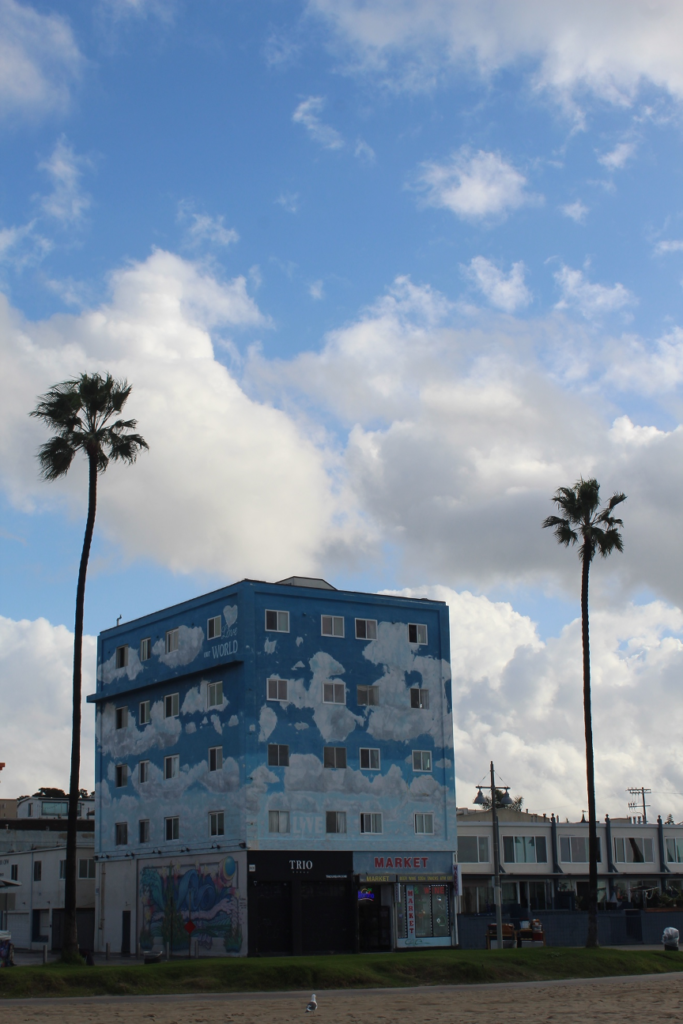
Yet another building along the Venice Boardwalk celebrates cumulus clouds that seem to mimic the background sky on December 25.
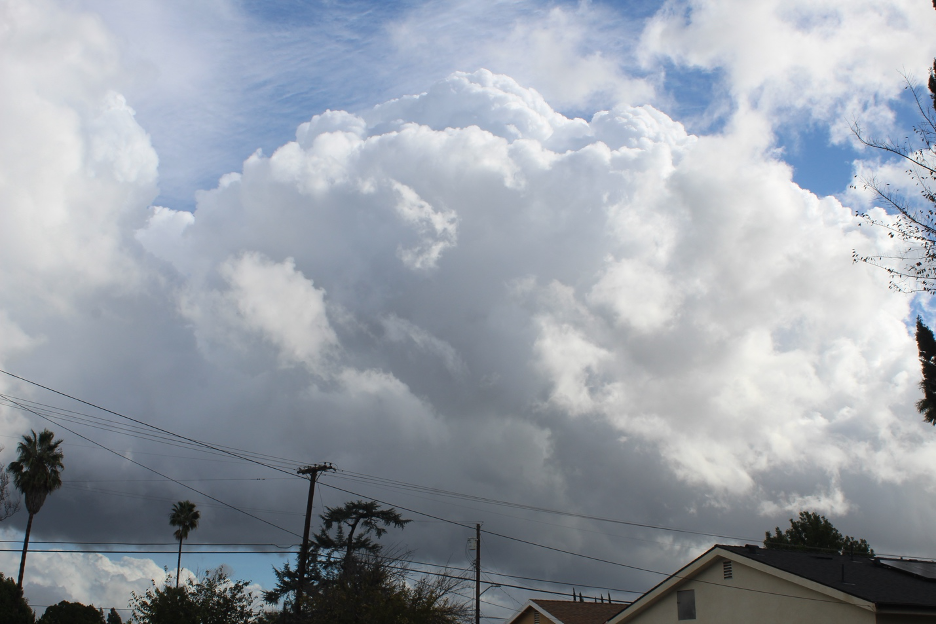
Meanwhile, more cumulus clouds tower above the San Fernando Valley, reaching toward high ice crystal cirrus during this rainswept Christmas.
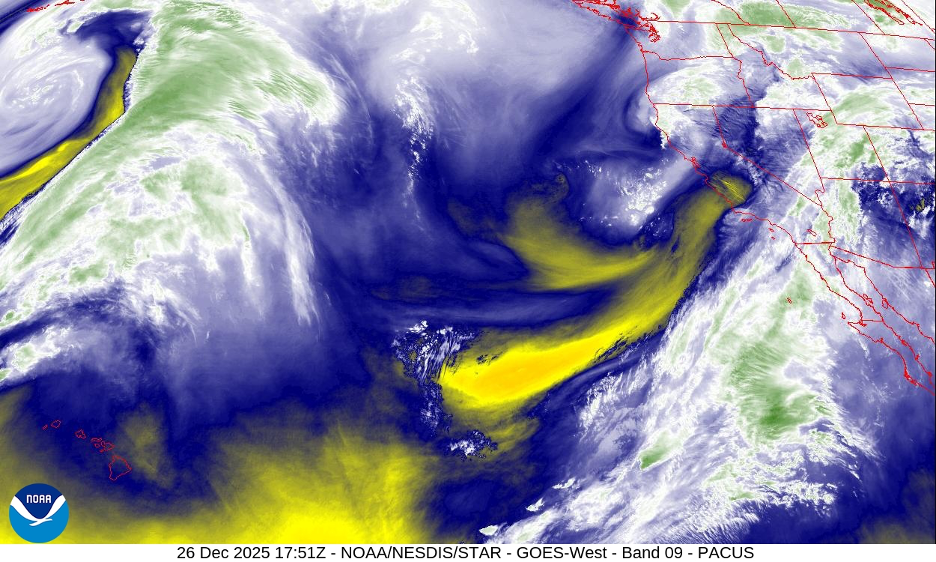
By December 26, an AR was drifting to the southeast out of California, followed by another impulse. Source: NOAA/National Weather Service.
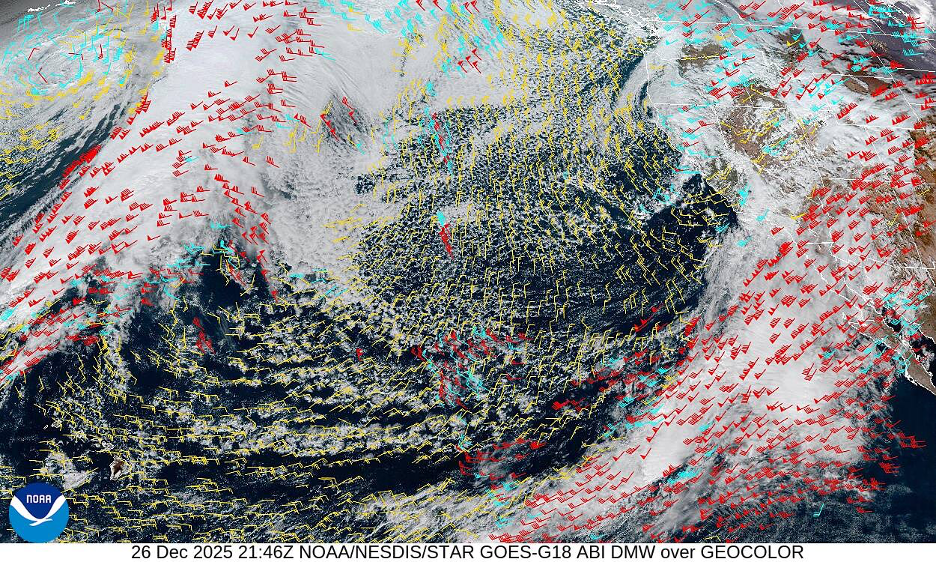
Another wind direction and speed big picture as the storm moves though. Source: NOAA/National Weather Service.
Compare this radar sequence to the day before and you can see how so much rain (up to a foot) can fall along Transverse Range slopes during just one day during these atmospheric river events. Source: NOAA/National Weather Service.
The passing trough brought even more bands of rain across California on the day after Christmas. Source: NOAA/National Weather Service.
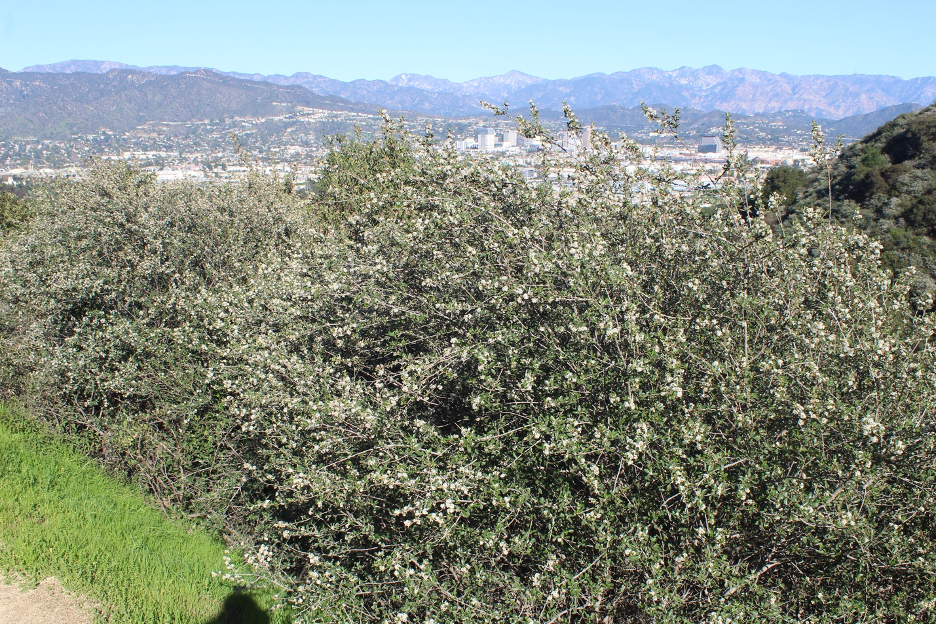
It’s only December 28, 2025 and the ceanothus has exploded with early blooms. Note the green grass, another sign that persistent early rains have soaked these landscapes in Griffith Park. Also notice how recent storms have swept the air clean, allowing clear views of older burn scars and the saturated San Gabriel Mountains and Mt. Wilson in the distance.
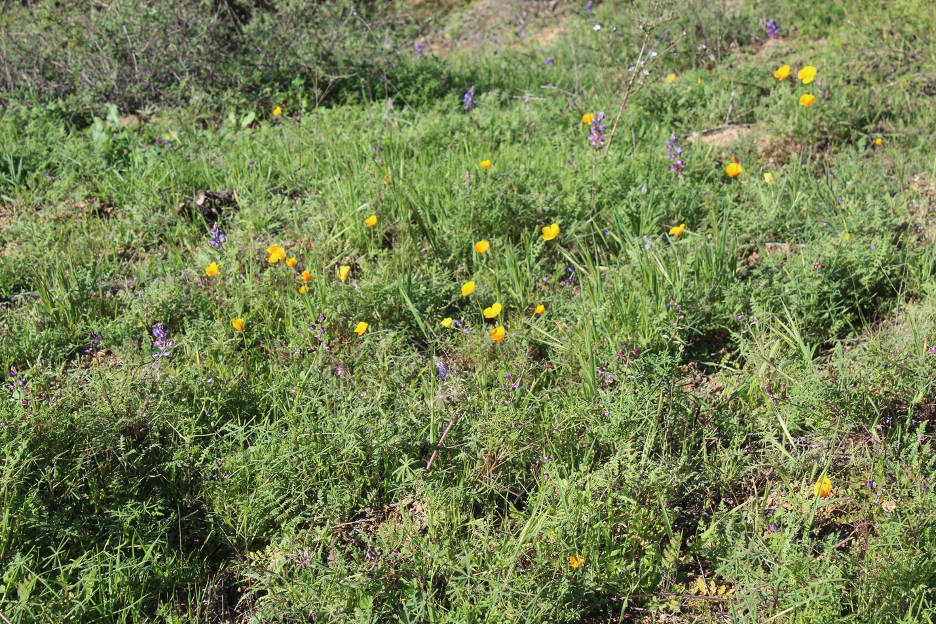
In contrast to last year, it’s already green on this side of the hill in late December at Griffith Park, thanks to about a foot of rain since October. California poppies, lupine, and other native wildflowers are struggling to find spaces between the crowds of opportunist weeds.
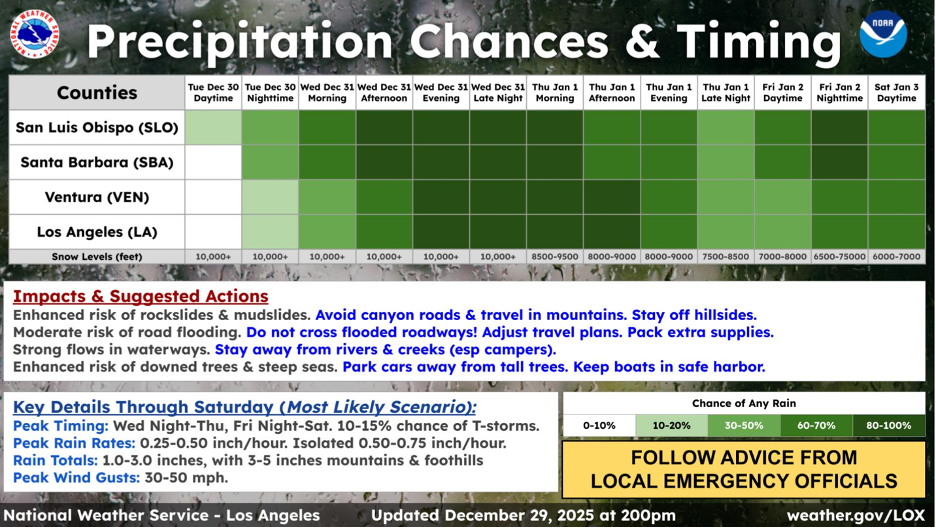
Yet another warm wet storm was approaching from the south on December 29. Source: NOAA/National Weather Service.
Incredibly, the 2025 holiday storm hit parade just kept on coming. NWS forecasters were interpreting models and doing their best to nail down the timing and intensity of each rain event that increasingly impacted already saturated slopes and burn scars.
This water vapor image shows another soaker rotating in on the last day of the year. It promises to rain on holiday plans and the Rose Parade. Source: NOAA/National Weather Service.
Storm clouds streaming up from the south dumped more rain on December 31.
The large New Year’s cyclone finally starts moving toward the coast, pushed east by another deep trough approaching from the northwest. Source: NOAA/National Weather Service.
Different views of the storm that kicked off 2026. Source: NOAA/National Weather Service.
The rain paused and clouds parted just enough by the afternoon of January 1, 2026 to encourage a long walk (the next six photos) at Bolsa Chica Wetlands in Orange County …
These ripples formed perpendicular to moist upper-level winds (blowing away from us) that roller-coastered over Orange County on January 1. Lower stratocumulus are leftovers from the storm that cleared out earlier in the day.
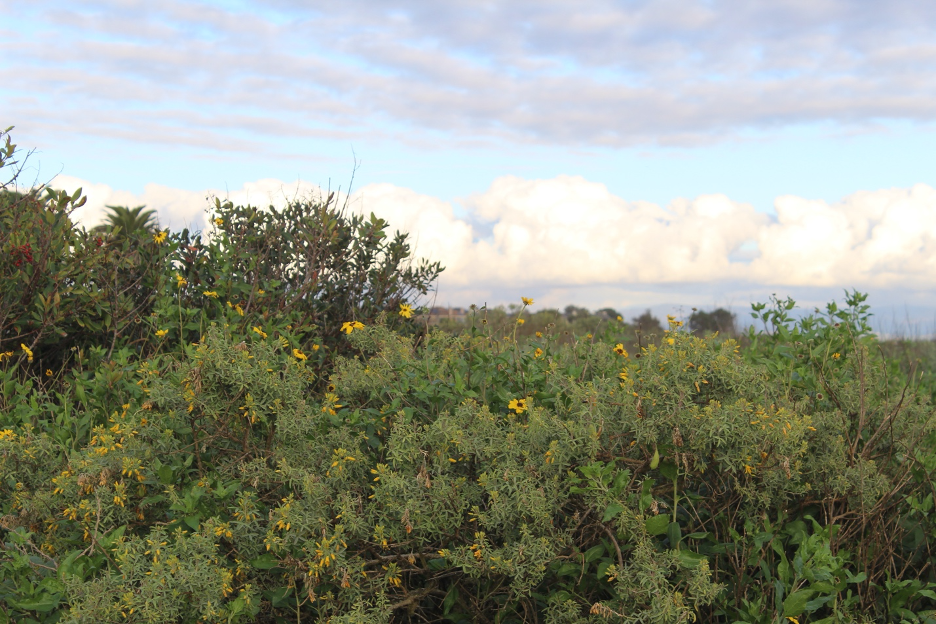
Bladderpod (Peritoma arborea) mixes with Coast Sunflowers (Encelia Californica) and they’re all blooming following the early rains.
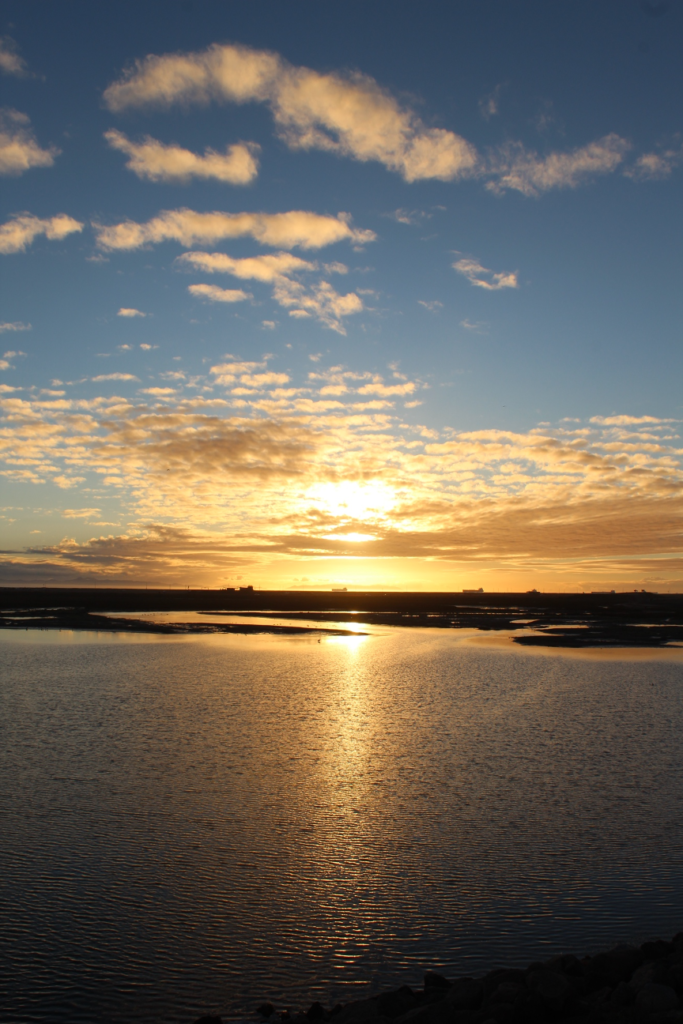
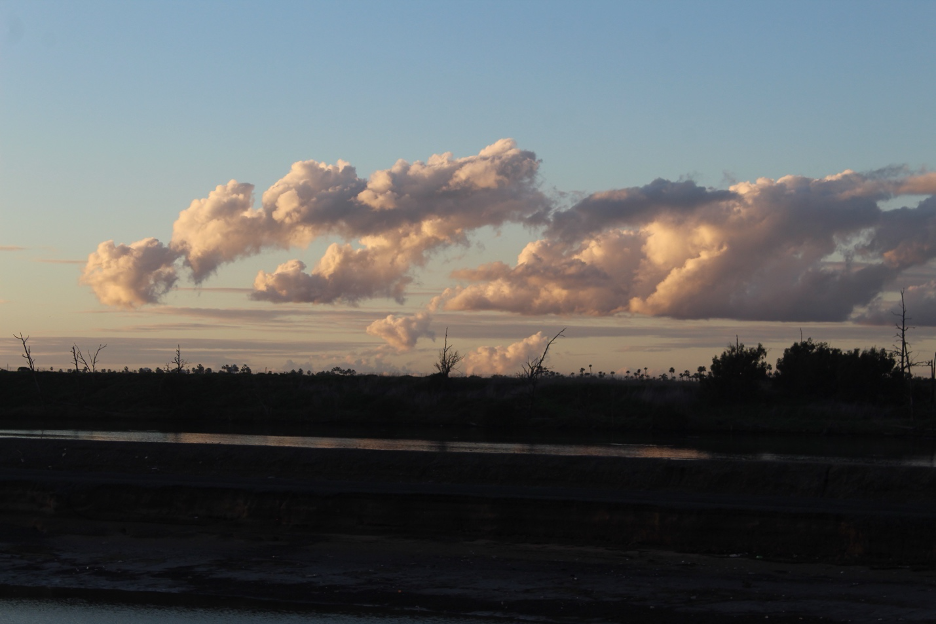
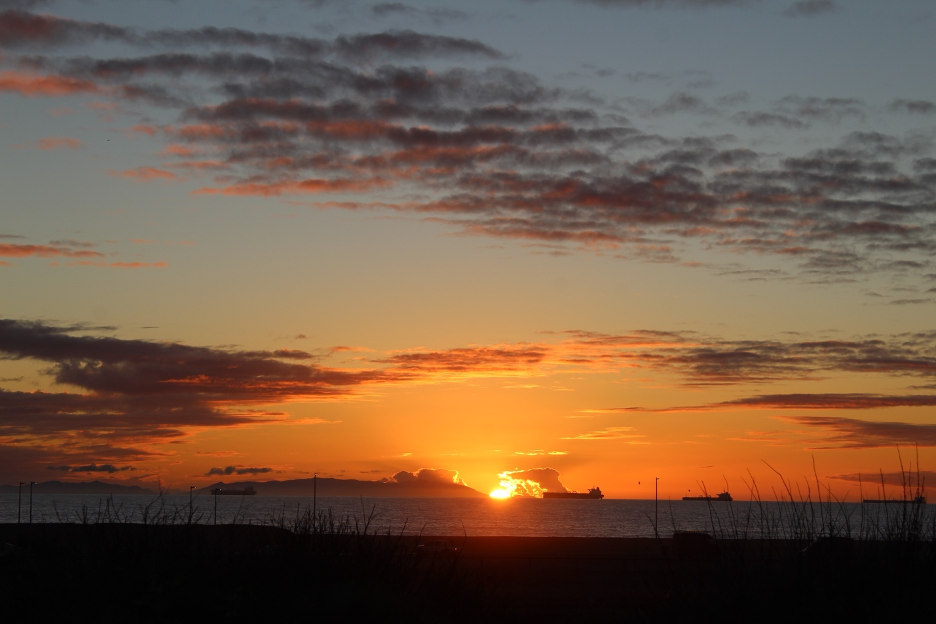
Sunset reflects off the wetlands as we look toward the ocean, distant queued-up cargo ships, and middle-level clouds drifting above it all.
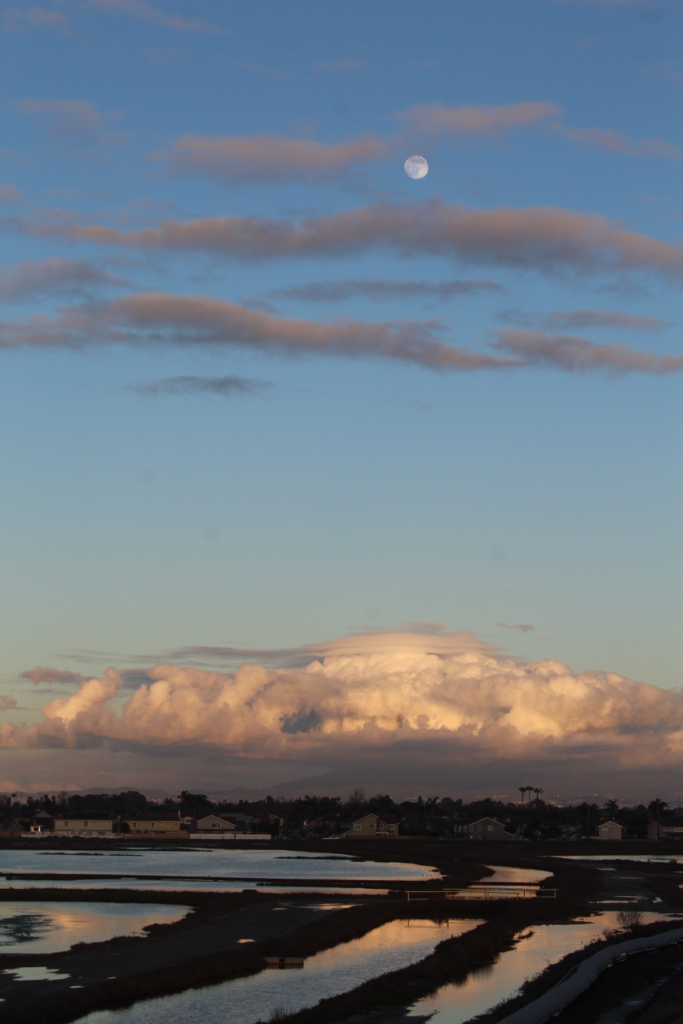
Viewing toward the east, the moon peeks through middle-level atmospheric waves. We also notice turbulent cumulus banking against distant mountains and pushing up into some pileus (cap) clouds.
Building cumulus get sheared by winds blowing off the ocean from left to right. Thinner layers of altostratus clouds are seen far behind them, as yet another storm system approaches from the northwest.
Look carefully toward Catalina Island to see distant towering cumulus framing the sun on the far horizon. On January 1, El sol has already begun its annual migration back toward the northern hemisphere. As it rises and sets slightly more to the north (right here) each day, we should be experiencing our wettest months of the year. But we’ve learned to expect the unexpected in recent years.
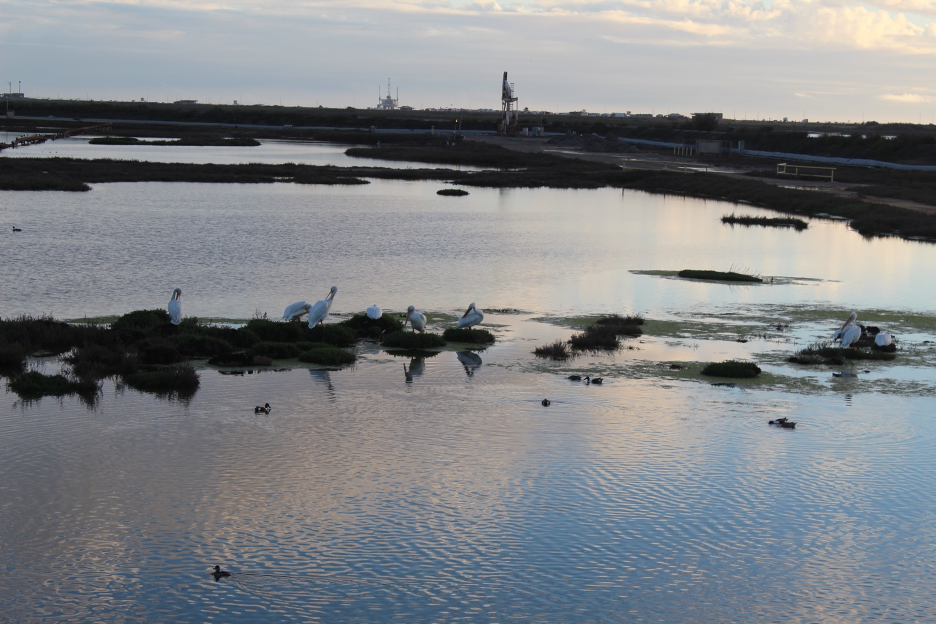
Decades of legal battles and restoration efforts at the Bolsa Chica Ecological Reserve have made this a haven for wildlife searching for rest stops, new homes, and dinner. You can watch the tides flowing in and out of these wetlands where some oil is still extracted after a storied petroleum industry history left its marks on the landscape. White Pelicans (Pelecanus erythrorhynchos) migrate here to escape harsh winters up north (likely from Canada or the Great Basin). You think the big birds you see here might be congregating with other avian species for some sort of New Year’s party, celebrating the calm between storms? And now that I’ve introduced yet another spinoff research opportunity, you can get started with maps and more info about white pelicans at the Audubon and here.
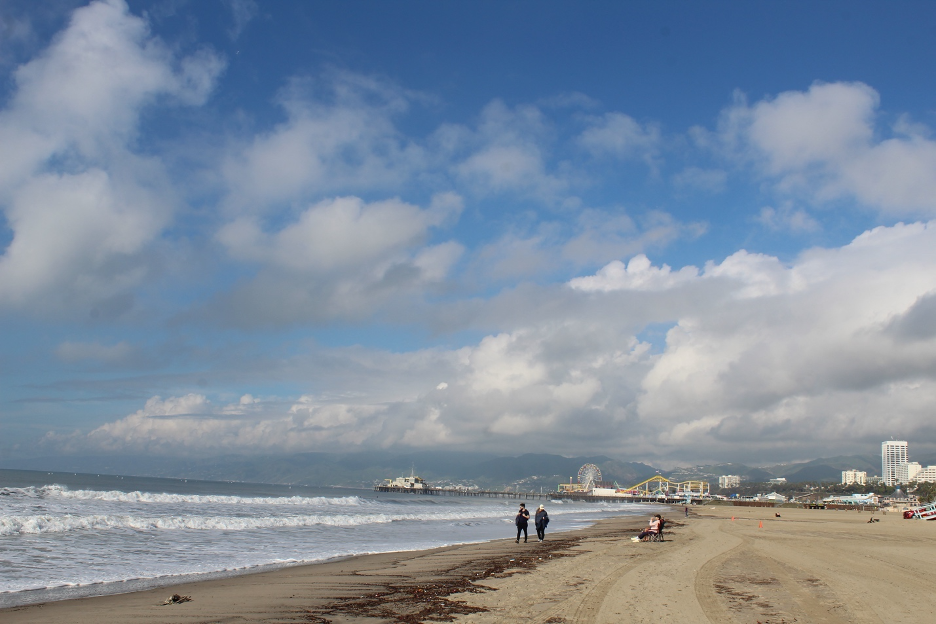
By January 5, the long series of Pacific storms were breaking up over and around Southern California, though one more impulse was sweeping rain and mountain snow across Northern California. Pressures were forecast to gradually rise throughout the week until a welcome period of high pressure and fair weather would give the state a chance to dry out. Here, cumulus clouds drifted with the onshore breezes, scattering a few showers as they banked against local mountains. Note the strand line left behind when storm debris was deposited during very high tides. You can also see tracks from the beach rake that cleared much of the debris.