How hot is it? Not to be outdone by record-breaking heat across the globe, several California regions shattered long-standing all-time high temperature records during this July, 2024. Many inland communities and populations who seemed prepared for another hot summer were overwhelmed by the intensity and duration of the historic heatwaves that scorched neighborhoods and ecosystems across the state. But just how hot was it and what caused this latest extreme weather drama? July’s average temperature of 81.7°F was the hottest month ever recorded across the state. If you want some scientific explanations, read on. If you are just looking for a list of hot temperature records, skim down to the end of this story. For those looking for more detail, check out the temperature/humidity appendix at the very end.
It all started as average global temperatures were setting all-time records for 13 months in a row, soaring well more than 2° F (1° C+) above 20th Century averages and even higher above pre-industrial norms. During this July, scientists measured some of the hottest single days ever recorded on Earth. You can learn more about such global trends within other stories on this website and in my new book published by Heyday, The California Sky Watcher. If you are interested in how urban heat islands are making us feel hotter, check out this colorful resource from NOAA that uses the power of GIS. Thanks to Professor Jing Liu! Now, on to our story.

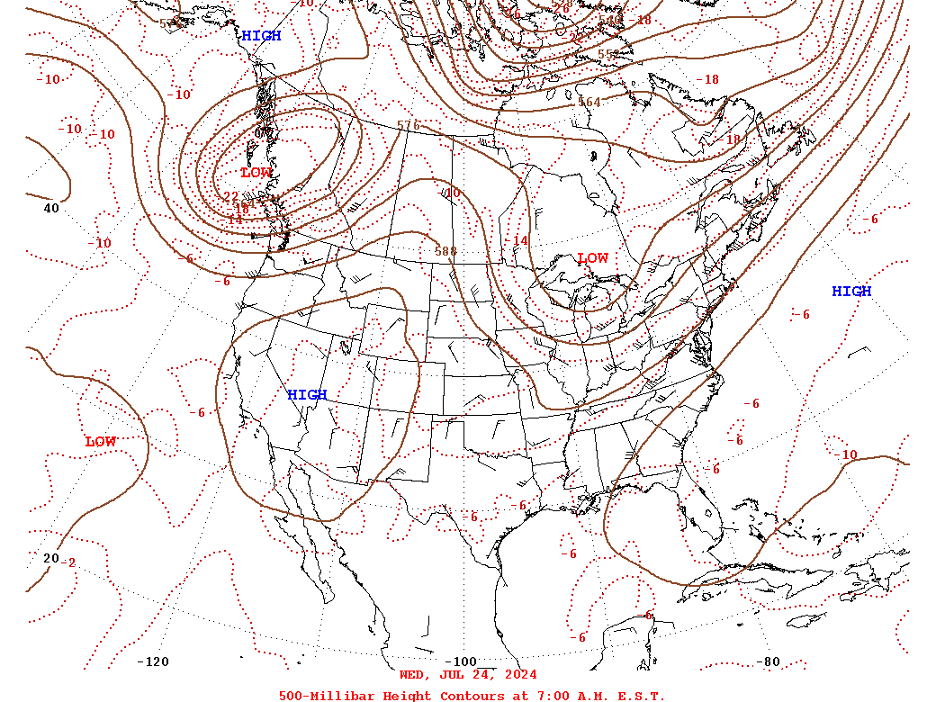
Our double-barreled subtropical high-pressure systems took over from there. We have previously emphasized how heavy, dense air masses descend out of high pressure. As they are compressed to lower altitudes, the air parcels are heated, similar to how you generate heat when you pump air into your bicycle tire or soccer ball. The billions of molecules are agitated, colliding together at millions of times per second. Because such heated air gains the capacity to hold more water in the vapor phase, water drops will usually evaporate so that clear skies and fair weather rule beneath these high-pressure domes.
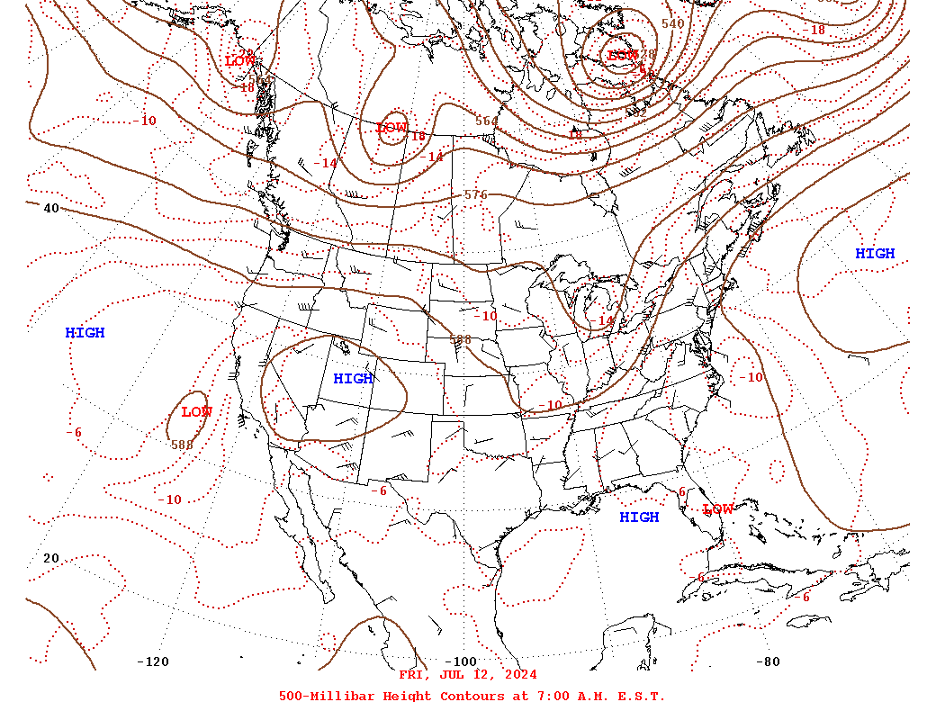
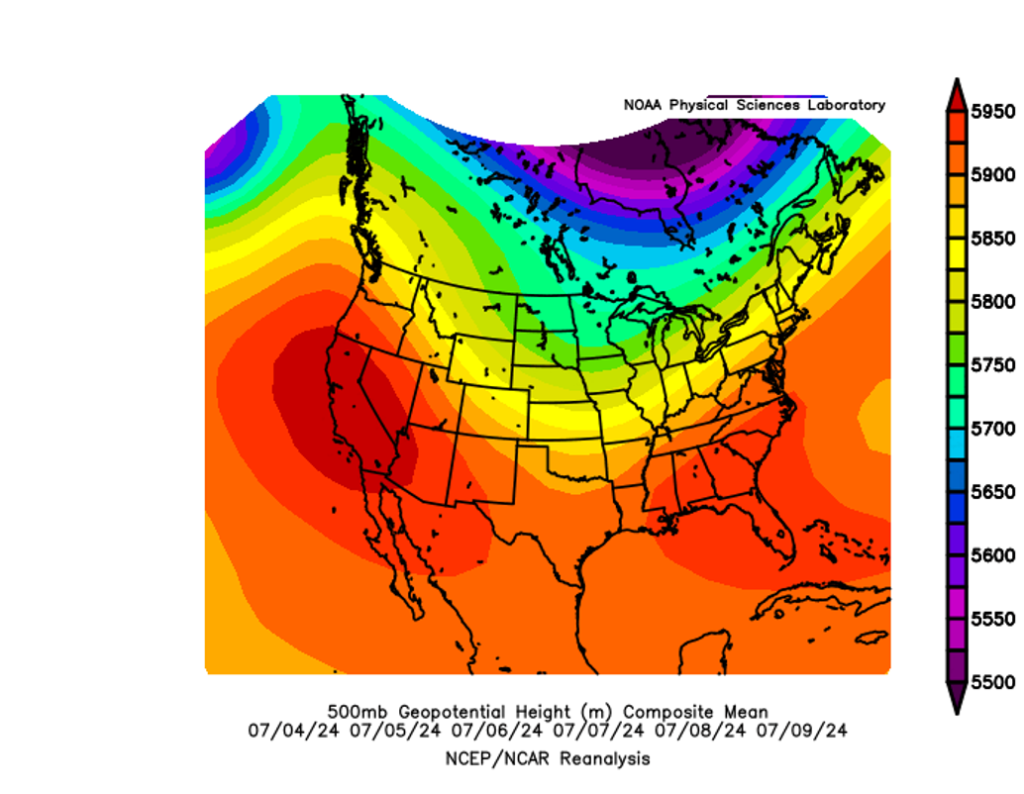
Energized global convection currents produce two high pressure systems that often impact California’s weather during summer. The first is that big North Pacific Subtropical High that dominates for thousands of miles off our coast. When it weakens and/or drifts farther away, we cool off as sea breezes and marine layers are free to expand and spread farther inland; there is also less compressional heating. But when it strengthens and bulges over the Golden State, the air is super-heated as it is compressed down toward sea level. Another upper-level subtropical high-pressure system frequently forms over the southwestern states during the summer. This system is commonly named the Four Corners High because it often anchors near the region where Utah, Colorado, New Mexico, and Arizona meet. When it strengthens and/or shifts a bit west toward California, it’s descending air parcels can also be compressed to produce memorable heat weaves. (This Four Corners High has also been dubbed the Monsoon Ridge because the clockwise flow of winds around it can scoop up moist air masses from the south and steer them into the Desert Southwest.)
Our July, 2024 weather was dominated by oscillations of these two high pressure patterns: it seemed that when one retreated or weakened, the other would move closer, leaving centers of exceptionally high pressure to settle directly over or near the Golden State. The result was oppressive inland heat that broke all-time temperature records. The long duration of these heat waves made them worse. Not only did they last several days, but the strong high-pressure cap aloft also kept overnight temperatures warm.
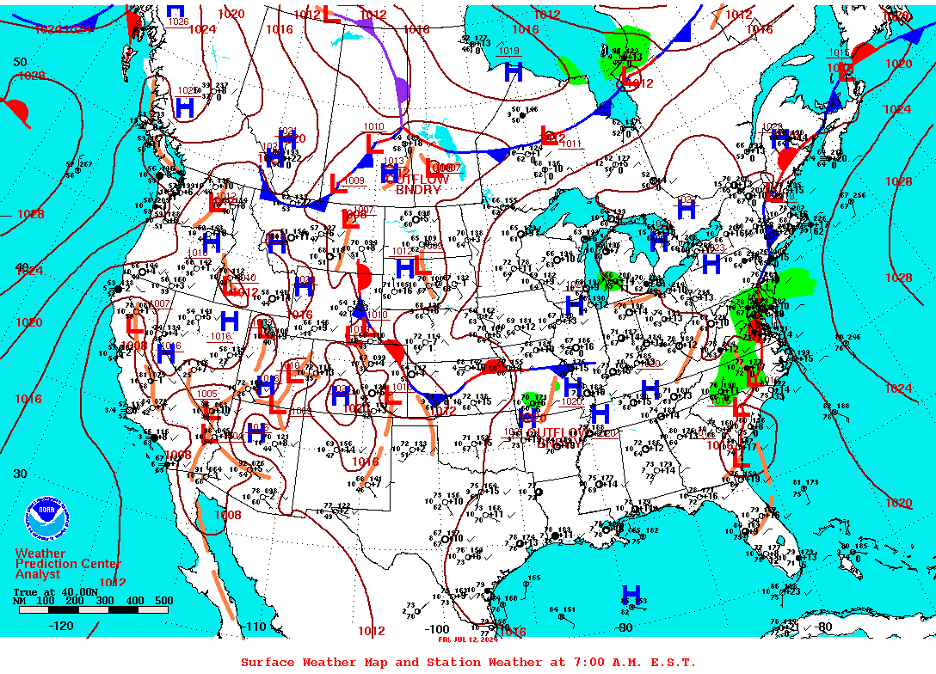
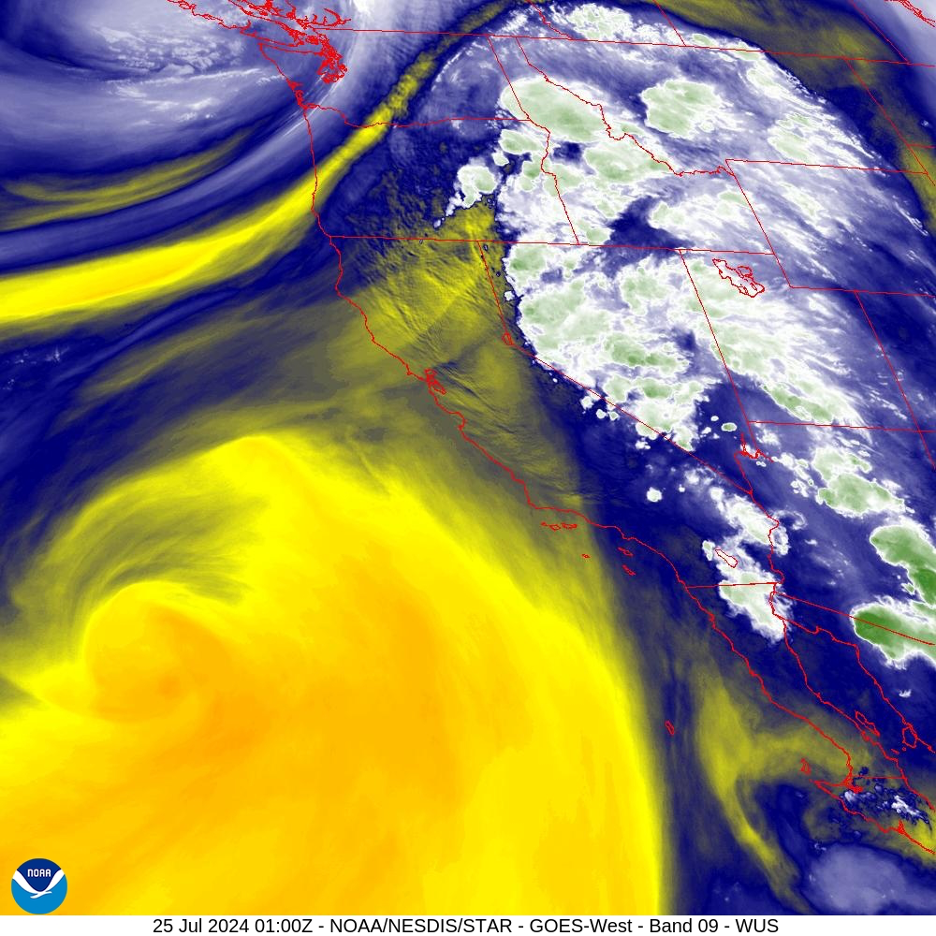
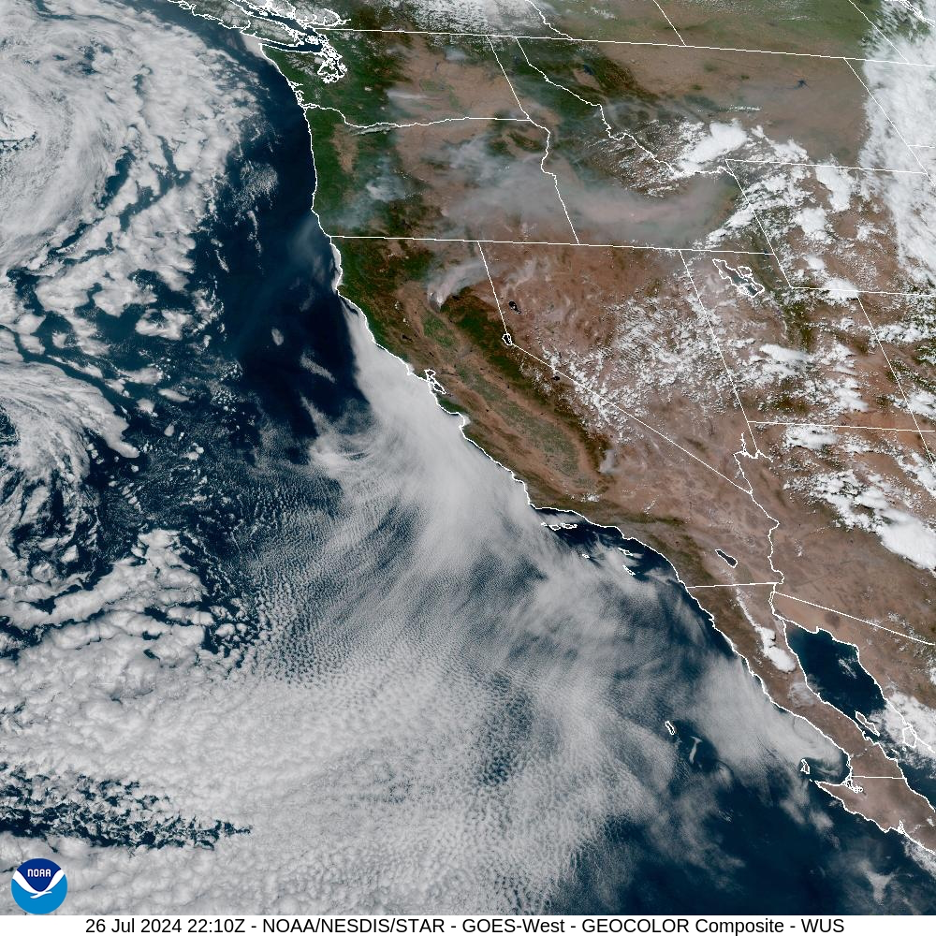
Cool relief can come from two directions. When low-pressure troughs drop down from the North Pacific and into the Pacific Northwest, they nudge high pressure away. (This was the case during the last weekend of July.) As air pressures decrease, cooling summer breezes sweep off the Pacific and penetrate farther inland. Another source of heat relief can arrive from the southeast. When that Four Corners High is positioned just right, the clockwise flow of winds around it will introduce moisture, mid- and high-level clouds, and even afternoon and evening showers and thunderstorms into our searing inland regions. The clouds shield surfaces from what would otherwise be intense radiation. Downdrafts and precipitation that fall out of these storms quickly chills surfaces, at least locally for short periods, often during what would have been the hottest time of day. A few of these events only briefly and locally doused the heat this July.

Here’s one specific example from Death Valley. That’s where daytime highs peaked at 125°F or higher for more than a week straight, including 129° on July 7. On July 13, the official weather station in Death Valley was recording a sizzling 110°F at 4am, down to an early morning low of 106 at 6am. (These almost unbelievable overnight recordings were posted on the official National Weather Service site.) By 3pm the next afternoon, the temperature had soared to 121°F. But it quickly dropped to 113 by 4pm, and only 91 at 5pm as a thunderstorm blew in with gusty winds and 0.12 inches of rain. Thirty degrees of relief in less than two hours! Experiencing such an abrupt switch from killer heat to a killer storm with flash flood potential can cause quite a surge in adrenalin; you can almost sense the combined soothing sigh of relief emanating from surrounding plant communities. Check out our website story from three summers ago about Storm Chasing in the California Desert. And here is a NWS story about how monsoon thunderstorms became severe and deadly in Phoenix, AZ on July 24. The other bad news is that such Infrequent invasions of this North American Monsoon moisture can also make it feel warmer as dew points and humidity rise in sultry air that doesn’t cool off as much at night. Relatively few cooling weather patterns during our heat waves of July, 2024 left us to cook beneath unrelenting, impenetrable high-pressure systems.
high pressure heat dome will finally weaken and get shoved away, at least temporarily, resulting in cooler temperatures statewide. Source: National Centers for Environmental Prediction, Weather Prediction Center.
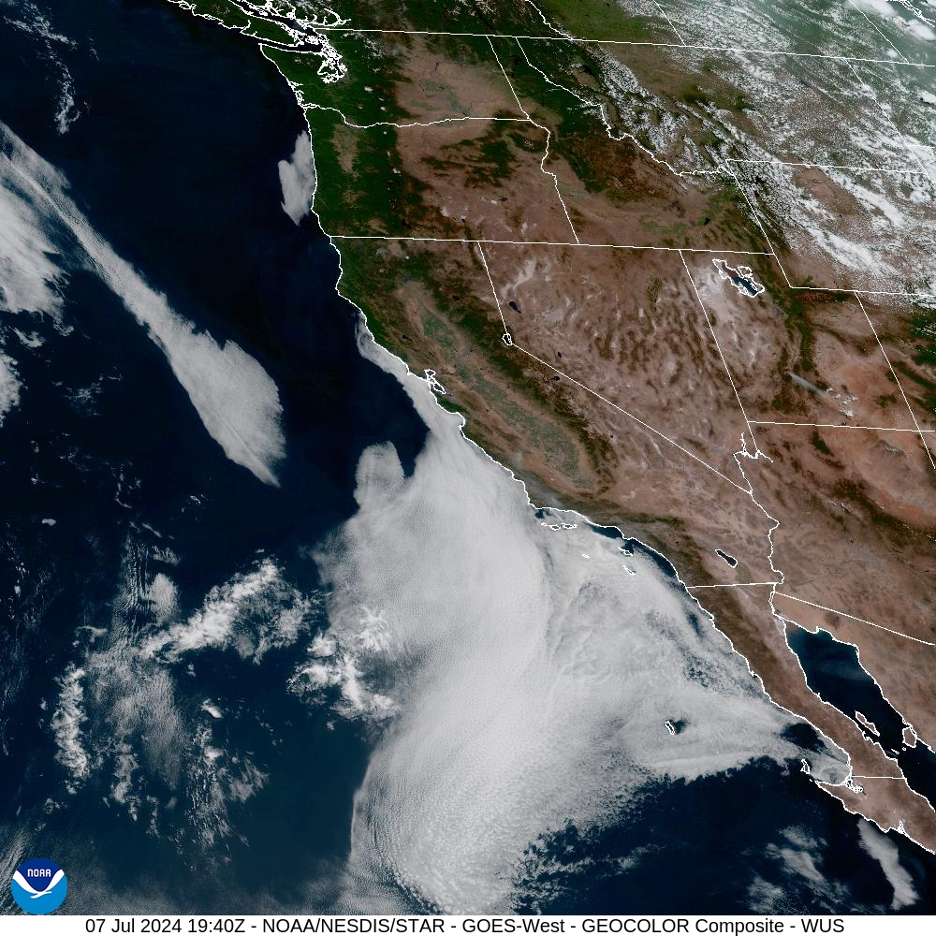
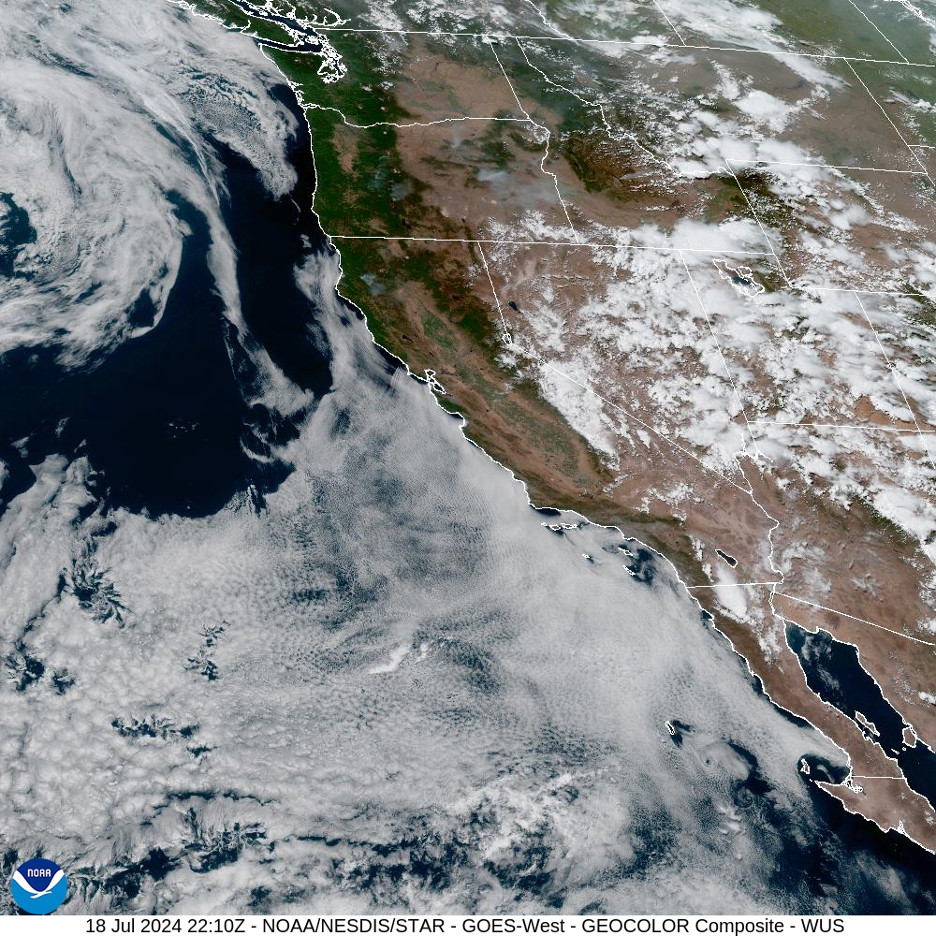
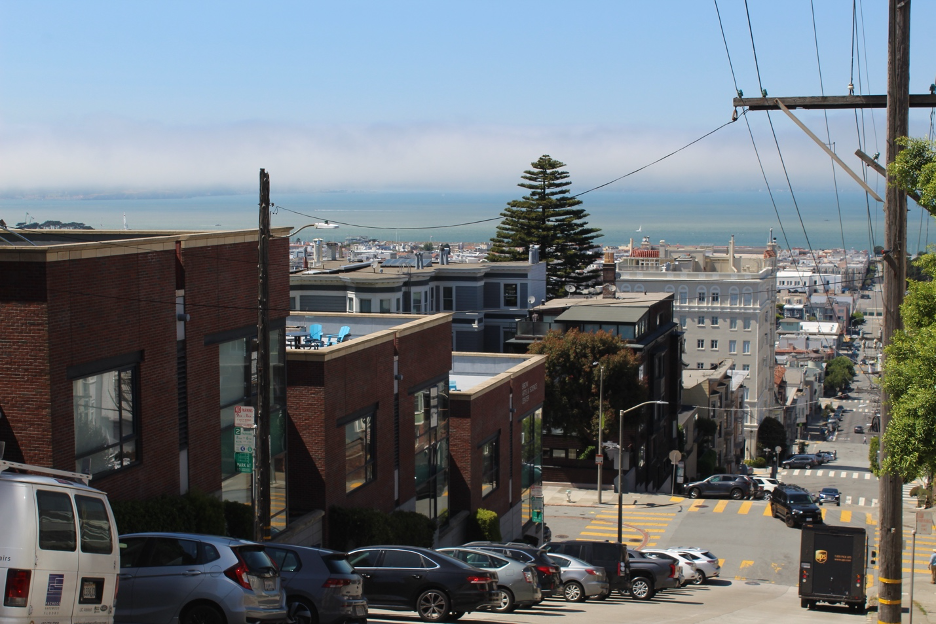
Before we acknowledge the July records that were broken, we must appreciate why they are all at inland locations. On Wednesday, July 10, I was fortunate to enjoy a San Francisco Giants MLB game at their beautiful Oracle Park overlooking the Bay. The hits and runs just kept on coming until the Giants suffered a 10-6 loss. As the game extended well into the evening, temperatures dropped into the high 50s, during California’s historic heat wave! Those sea breezes had kept the immediate coast (from northern to southern California) cool as inland regions baked, leaving folks near the coast (where daytime highs hovered in the 60s and 70s F) wondering what all the heat-related fuss was about. From there, I had to drive a little more than an hour inland to Davis (to attend an Extreme Precipitation Symposium that attracted some other weather geeks like me and a lot of engineers who are responsible for protecting us from costly flooding during our winter storms). As I approached Davis, the temperature was still 84 degrees after 10pm, at least 25 degrees warmer than San Francisco! The official Davis temperature would peak on the next day at 111°. I’ve experienced such radical changes in summer temperatures (between the coast and inland valleys) so many times, from northern to southern California, I’ve lost count. But I’ve also shared many of these observations with you on this website and in our book.
Immediate coastal locations will have to wait for their hottest days in the sun, as they usually experience their own record-breaking heat as we get into August and September. As we progress toward autumn, the land begins to cool a bit, ocean temperatures reach their annual peaks, and upper-level pressure and wind patterns change. Temperature and pressure gradients occasionally reverse. This is when warm offshore breezes more frequently descend down the mountains and out of inland regions toward the coast, occasionally pushing the misty sea breezes back out over the ocean. You will also find plenty of these autumnal stories on this website and in my new book.
But let’s return to the record-breaking heat of July, 2024. You might have heard that heat has killed more people in the US during the last 30 years than other severe weather, including lightning, floods, and hurricanes combined. And as feared, these relentless Golden State inland heat waves sickened and killed a lot of people. Cooling shelters grew more crowded as the oppressive heat took its toll day after day. It got so hot that cans with carbonated drinks exploded on Southwest Airlines flights. Flight attendants were injured by rupturing cans that were not refrigerated during storage or loading. Cans at more than 98°F had to be sent back before they could become “bursting hot cans”, especially from sizzling southwestern cities such as Phoenix, Las Vegas, and even Sacramento.
You could almost hear that giant sucking sound as the hot atmosphere pulled precious moisture out of soils and ecosystems across the state. Wildfires erupted and raged out of control, scorching dehydrated plant communities. Evapotranspiration rates (all the water evaporated from the soil, plants, and water bodies) skyrocketed, causing millions of gallons of stored water to be lost from valuable reservoirs such as Trinity Lake and New Melones. Officials at the U.S. Bureau of Reclamation and other agencies estimated that our state’s largest lake, Shasta, lost more than 4 billion gallons to evaporation in the first three hot weeks of July.
So, finally, how hot was it in July, 2024? The following are some notable records.
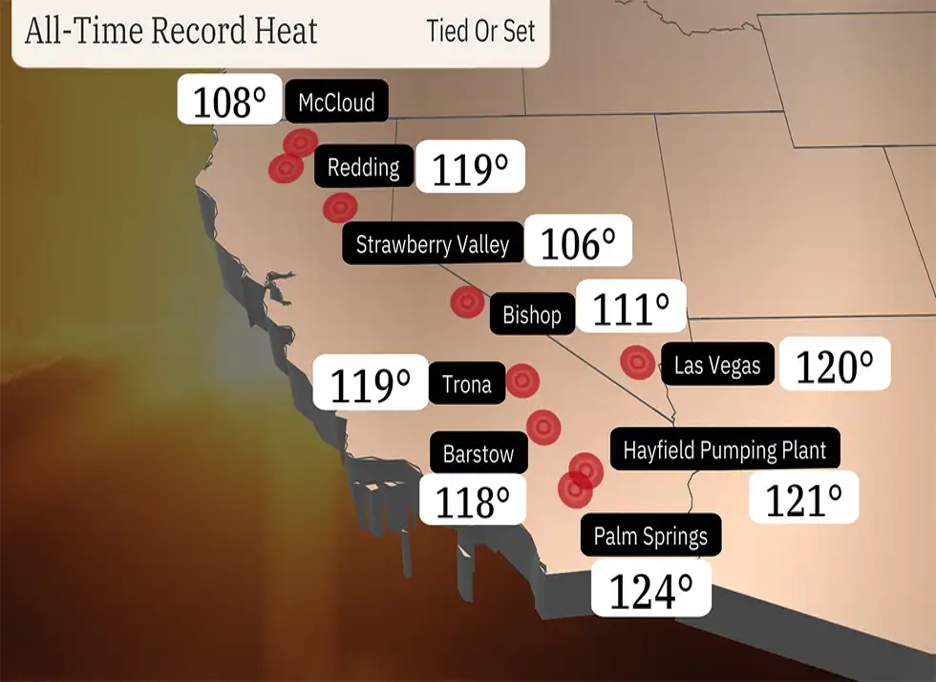
Some other notable high temperatures with comments:
July 5:
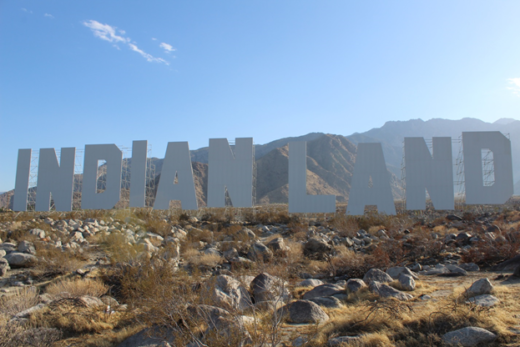
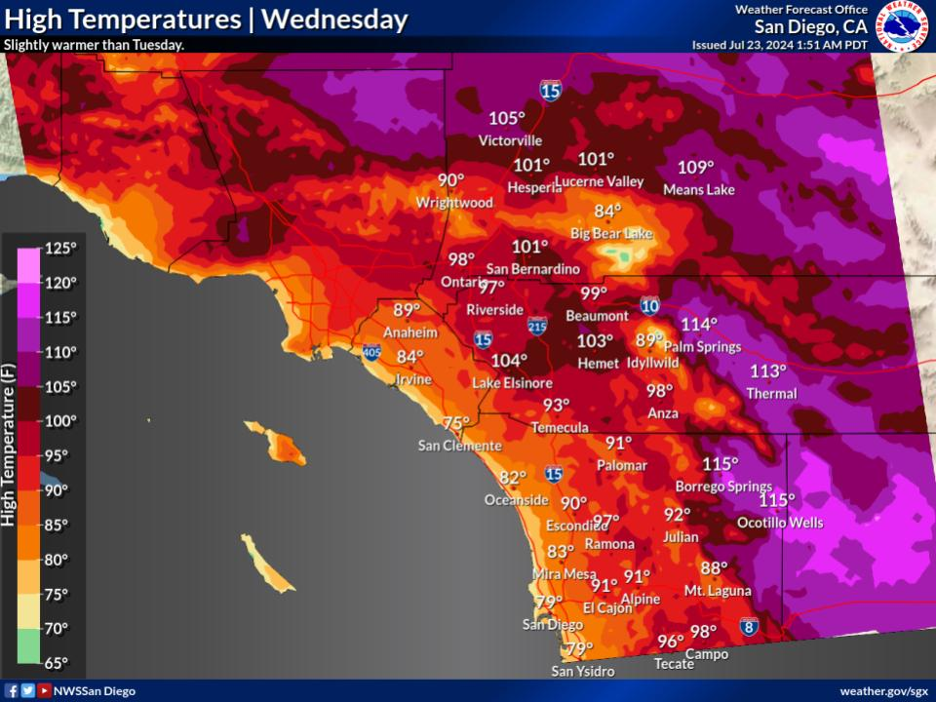
Palm Springs: 124°, all-time record.
Idyllwild (in the mountains only about 15 miles from Palm Springs, but above 5,000 ft.) tied its all-time record at 104°.
Oceanside: 71° (more than 50 degrees cooler than Palm Springs, just about 71 miles away).
Saugus: 118°
July 6:
Sacramento recorded 113° during the all-time hottest 20-day stretch in history (as high temperatures averaged 103.8°).
July 7:
Las Vegas: 120°, all-time record and 7 straight days at 115° or more.
Their July 11 high/low was 117°/98°.
Palmdale 115°, all-time record.
Death Valley 129°, with more than a week of highs at 125° or more and some overnight lows above 100°. Many heat-related illnesses included motorcyclists and one death. A tourist suffered third-degree burns when walking on the dunes.
Barstow tied its all-time record three days in a row, July 7-9 at 118*.
Bishop (at over 4,100 feet) recorded 5 straight days at 110° or higher, a record.
A few other July high notables:
Redding 119°. Not only was this the all-time record, but it remained at 118° from 2:53-6:25pm, with only brief dips to 117°.
Bakersfield, 112° (not a record, but new record for consecutive days above 105°.)
Livermore (in the far East Bay) 108°.
Meanwhile, north and central coast temperatures hovered in the cool 60s through some of the hottest days, including San Francisco at 70° and Monterey at 64°.
Those temperature measurements were recorded at official National Weather Service standard stations. If you are interested in some details about official recording stations, check out this article by William Patzert (Southern California’s long-established go-to weather researcher and celebrity) and others. The article summarizes how important it is to keep consistent records at the same sites when we measure climate change and how moving those stations around can cause problems:
Bill Patzert also sent out this article from the LA Times that summarizes California’s July, 2024 heat wave.
Here is a summary of how the North American Monsoon impacts summer weather in the Desert Southwest.
In case you missed it, here is that colorful resource from NOAA that uses geospatial technologies to illustrate how urban heat islands are turning up the heat in our cities. Thanks again to Professor Jing Liu!
The 2023 Annual Global Climate Report summarizes how California is just another example of more general temperature trends around the globe.
Jing Liu also shared this research suggesting how climate change is impacting El Niño/La Niña cycles.
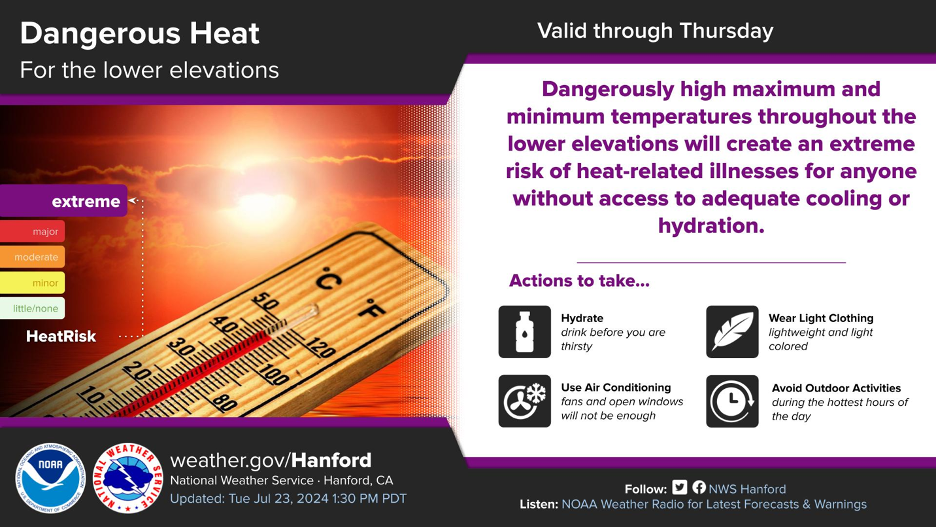
FYI, here are three helpful announcements, reminders, and warnings that appeared from three different National Weather Service offices during the heat wave:


Let’s end with an appendix that examines temperature and humidity.
A Study of How Temperature and Humidity Interacted During the July, 2024 Heatwave.
We often sense how temperature and humidity change throughout the day and night. This is especially important during heat waves, since the humidity can make us feel more or less comfortable and it can also dictate evapotranspiration rates, or the amount of moisture plants and animals lose to the hot air. There is a diurnal dance between temperature and relative humidity.
Since relative humidity is defined as the amount of water vapor in the air relative to the amount of water the air can hold, it is dependent on two main factors. First, very moist air should have a higher relative humidity since it has more water per weight or volume of an air mass (known as specific or absolute humidity since those two terms refer to the total amount of water in the air regardless of temperature). Specific or absolute humidity can range from less than 1% of the air (dry) to around 4% (wet). Air loaded with a lot of water will have higher dew points and reach saturation (100% relative humidity) more quickly at higher temperatures. By contrast, very dry air must get much colder to reach its dew point and become saturated.
Now we can see how temperature changes will change the relative humidity. During most nights, temperatures drop, bringing the air closer to its dew point and near saturation. Relative humidity goes up. This is why we often find dew on cold surfaces late at night. During most days, temperatures increase and the air gains the capacity to hold more water vapor, so that the temperature is more often much higher than the dew point. Consequently, lower relative humidity is common during the afternoons. We’ve often mentioned how this explains “late night and early morning low clouds and fog, otherwise mostly sunny during the afternoons.” When temperatures drop at night, the air loses its capacity to hold water vapor and may become saturated. Condensation sets in and low clouds and fog appear. As air warms up during the day, temperatures often soar above the dew point. The fog and low clouds “burn off” as the warming air gains capacity to hold more water in the vapor state. Relative humidity decreases.
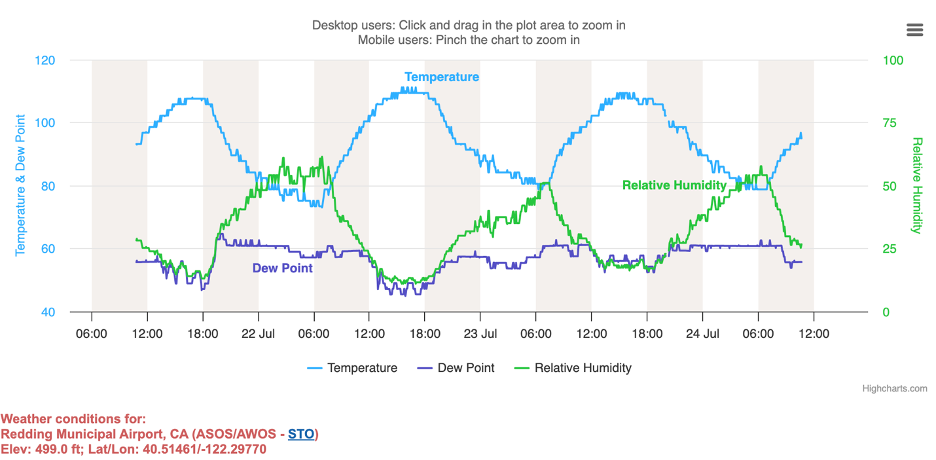
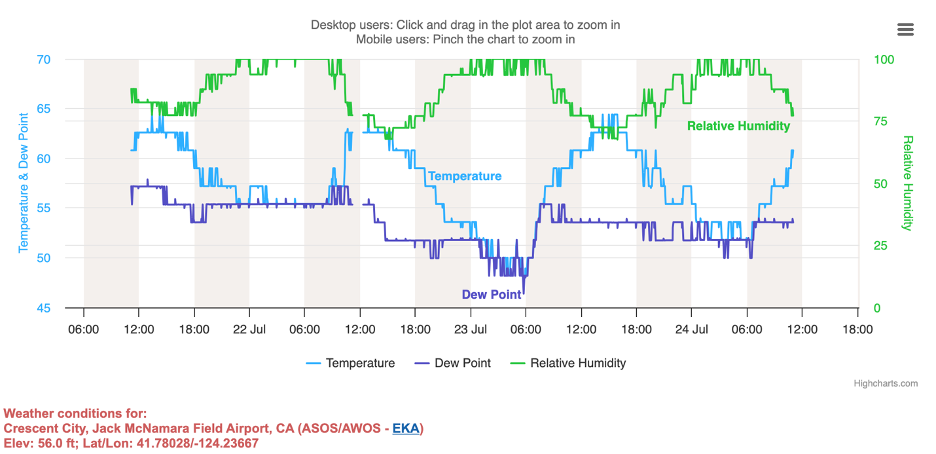
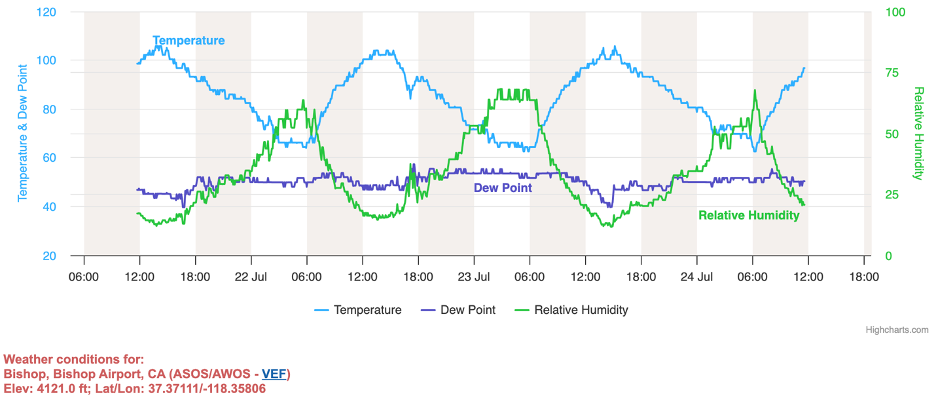
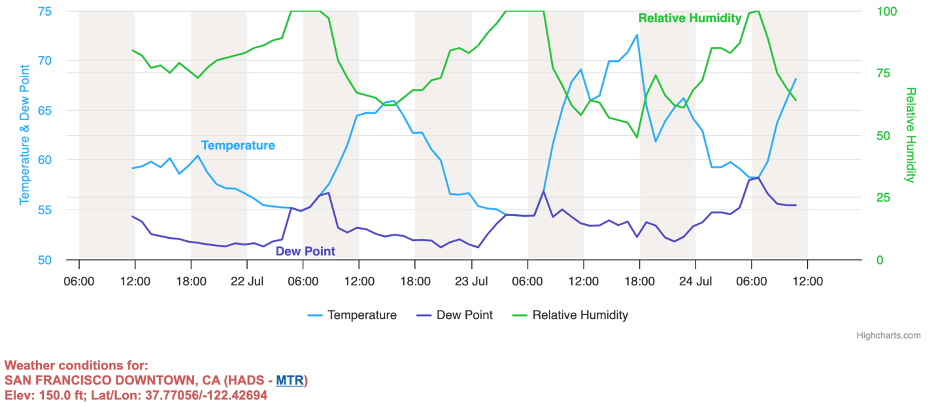
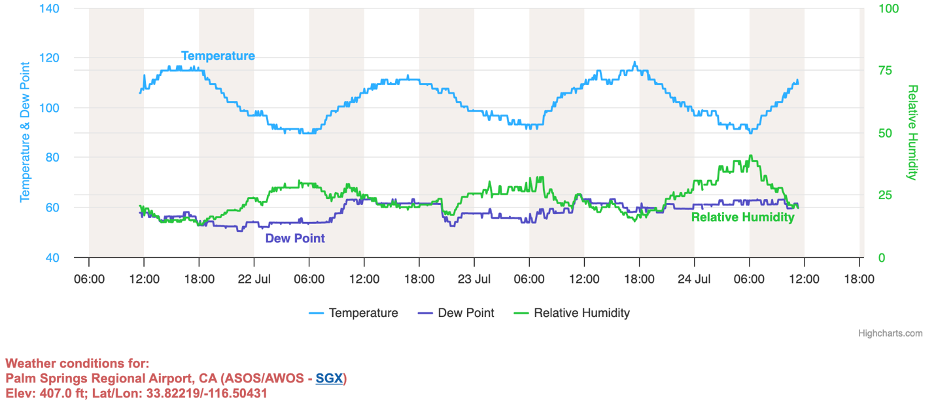
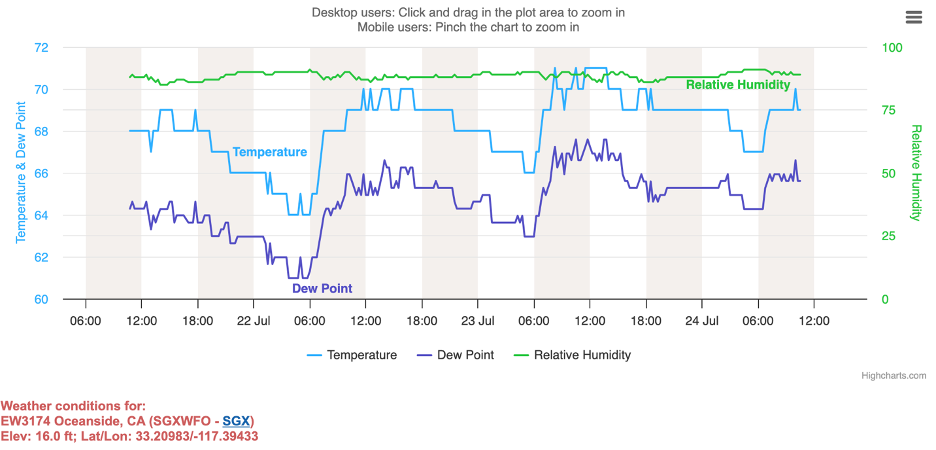
We can watch this diurnal dance between temperature and relative humidity. I’ve chosen National Weather Service data from six California weather stations near the end of the historic heatwave of July, 2024. Three are right on the coast and three are far inland, behind mountain barriers that block ocean breezes. The stations appear in sets of two: Crescent City on the north coast versus Redding, tucked behind the mountains in the Sacramento Valley; San Francisco on the central coast versus Bishop in the high desert, tucked behind the Sierra Nevada; and Oceanside on the south coast versus Palm Springs in the Coachella Valley, tucked behind the San Jacinto Mountains.
It should be no surprise that the coastal locations exhibit higher relative humidities in the cool, moist air and the inland locations record lower relative humidities in the warm, dry air. Watch the diurnal do-si-do of temperatures (in blue) and relative humidities (in green).
Redding
Crescent City
Bishop
San Francisco
Palm Springs
Oceanside
THE END