Experiencing autumn’s Santa Ana winds in southern California (and similar winds in northern California with names such as Diablo) and the occasional wildfires they fan would leave any curious person yearning to learn more about them. Here is a quick summary of the science behind these events along with some supporting images. If you want more information to build your foundation of knowledge, you can always consult Chapter 4 of our publication.
Our weather science story begins when summer turns to autumn. Land masses in the Basin and Range and Desert Southwest begin cooling much faster than the ocean surface. Summer’s less dense, expanding air masses in the thermal low pressure that has dominated over land are replaced with cooler, denser, sinking air masses in the Basin and Range during many fall and winter days and especially colder nights. The thermal low that was sucking in summer’s sea breezes from the coast is replaced by the cooler Great Basin High surface pressure that forms in this frigid air of fall and winter. As heavy, dense air settles out of this high pressure system, the wind flows away from the high and toward now relatively low pressure near the coast. The Coriolis effect spins this land breeze a little to its right as it flows over California. These cooler air masses are forced to compress and squeeze through California’s mountain passes and canyons on their way toward sea level and the coast. This compression heats an already dry continental air mass as it cascades into inland and coastal valleys on the ocean sides of the mountains. Relative humidities can drop well below 10%.
Whether you call them Santa Ana (southern California) or Diablo (northern California) winds, they announce fall’s arrival. Each year, we witness a competition that will determine the severity of our state’s fire season. Will the first weather fronts drop down from the Pacific to bring quenching rains to a state parched by several months of summer drought? Or will the dry winds come first, blowing across fire-adapted pant communities and baked soils that haven’t yet received the season’s first showers? Every year is different. In the fall of 2017 and 2018, brutal winds arrived before the rains, following especially long, hot, dry summers. Relative humidities dropped below 10% in the compressionally heated winds that fanned epic firestorms of death and destruction.

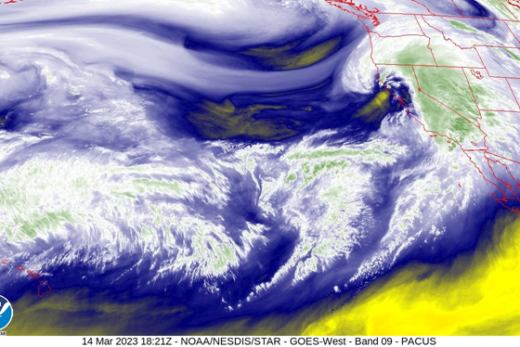
The accompanying weather maps (thanks again to NOAA’s National Weather Service) display some specifics from the most deadly days of November 2018. The surface map shows a steep pressure gradient from inland to the coast. And this event had the upper atmosphere support that is so important in bolstering the offshore winds so that they howl throughout the day and night. Note the 500mb map that shows air pressure and wind flow patterns approximately half way up through our atmosphere, around 18,000 feet (5,600 meters). Here, you see a large ridge of high pressure over the eastern Pacific that extends above the California coast. This shows upper level support that encourages a stronger offshore flow. Upper level winds will blow roughly parallel to the lines on this isoheight map (this map showing the height of 500mb) as those meandering winds flow west to east around the globe. You might be familiar with the upper level jet stream that can be embedded within these air flow patterns.


Just as these upper level winds curve up toward the north and over the ridge, they then meander back down south, toward the adjacent trough. This upper level motion causes the stream of air to slow down and become denser and heavier just east of the ridge, similar to how traffic on the freeway slows and bunches up behind various obstructions. Here is where negative vorticity advection and anticyclonic flow usually dominates. This denser air sinks, fortifying high pressure at the surface. It’s the combination of this upper level support on top of the already cold, dense high pressure at the surface that creates the strongest offshore winds. Winds blow out of this strong surface high pressure and toward lower pressure near the coast or out into the ocean. The Coriolis effect pulls the winds slightly to their right, spinning the air clockwise out of the high, resulting in strong surface winds that may gradually shift from north to northeast to east over days as the high pressure slowly migrates farther east. Eventually, the pressure gradients ease as the pressure cells change and migrate; the offshore event ends.
The good news is the fires are contained in the relative calm aftermath. The bad news may be displayed in layers of residual smothering smoke that hover over and downwind of the fires in the stable air. This air quality problem that takes us full circle to the start of our fire essays earns one more lesson in weather science. After the high pressure responsible for these offshore winds weakens and/or moves east, normally migrating northern hemisphere pressure systems and their shifting winds often disperse the smoke and may even deliver precious moisture to parched landscapes as winter’s storms begin to drop south and clear the air. In other cases, the weather patterns may briefly stall, leaving a stable, stagnant atmosphere lacking the winds necessary to disperse smoke from the fires.
The later was the case on November 10, 2018, the day after the Woolsey Fire erupted in southern California as the L.A. Basin was shrouded in orange and red. Dangerous air quality was measured until another Santa Ana event scoured out the basin on the next day. Still, one week after the Paradise Fire erupted and was being successfully contained, a veil of toxic smoke from that blaze had covered the Sacramento Valley and drifted all the way over the Bay Area. Schools were closed, athletic events were canceled, and officials discouraged any outdoor activities from the Sacramento Valley through the Bay Area. Even The City’s iconic cable cars were shut down.


How bad was it? We can start with the gone-viral photo taken by editor David Little and published by the Chico Enterprise Record just as the Camp Fire was spreading terror and death. As the winds gradually subsided, so did the air masses, allowing the accumulating smoke clouds to creep across the Sacramento Valley until they were finally strangling the Bay Area. Six days after the Camp Fire started, air quality was still some of the worst ever recorded in the region, the accumulated smoke capped by a ridge of high pressure overhead. More than 35 micrograms of small particulate matter per cubic meter are considered unhealthful by federal standards. But monitors around Chico and Gridley were recording more than 300 micrograms and one temporary station between Chico and Paradise recorded dangerous amounts over 900 micrograms per cubic meter. These microscopic particles of ash can lodge deep within the lungs, causing serious health problems.


So these latest nightmares started with the dreaded National Weather Service wind advisories and red flag warnings for November 9, 2018 that turned out to be spot on. They included those NWS warning maps covering an area from the coastal ranges across the Central Valley and well into the Sierra Nevada foothills. At the same time, another NWS map displayed high wind or red flag warnings for all southern California mountains and coastal valleys. As was feared, apocalyptic firestorms swept through both regions. One week later, the maps forecast the dangerous air quality that spread into the Bay Area as responders dug through the ashes in Paradise hoping not to find the remains of hundreds of people still missing. Luckily, most were finally found alive, except for the 85 victims who perished. Our mission and responsibilities couldn’t be clearer or more urgent: our efforts to better understand the forces of nature and our interactions with them, and our abilities to anticipate what comes next require our immediate attention.
The National Weather Service is the original source of all weather forecasting information in the United States.