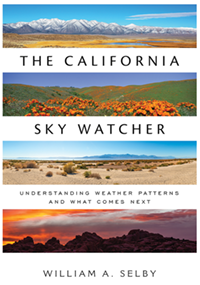
Welcome to California’s latest wild swings in peculiar and occasionally cataclysmic weather patterns, brought to you by the winter of 2023. This story is part of our continuing expansion and exploration into California’s weather and climate, an ongoing project anchored by our comprehensive publication that will follow. In this guide, we track a soggy saga that will endure in state history books.
We started the 2022-2023 rainy season in the grip of our historic 22-year megadrought. According to the paleoclimatology record, it was the most severe in at least 1,200 years. Just as in the previous year, storms broke through our resilient ridge and spread early and promising rain events and impressive mountain snowfall from autumn into December. In contrast to last year’s faucet shutoff that resulted in the driest January-March (our state’s traditionally wettest time of year) on record, relentless drenching storms continued to inundate the state in 2023. By March, some locations were experiencing one of the wettest or snowiest winters on record. Though nearly everyone felt impacts, the incessant firehose mostly and curiously aimed from the Bay Area down the central coast and dragged inland across the Sierra Nevada.
Figure 1. A Short Respite. Moist air and stratocumulus chase one of the season’s first wet weather fronts inland. Californians had no way of knowing that November’s beneficial storms were harbingers of drought-busting deluges to come. Such brief but blustery sunny breaks would become welcomed sights during the 2022-23 rainy season.
A series of atmospheric rivers first drenched the state (especially central California) and carried into mid-January. Weak ridging followed, keeping transient storms under control, often routing them along a more inland or inside-slider track into mid-February. But this pattern also brought exceptional cold snaps that plagued the state, maintaining already excessive Sierra Nevada snowpacks. Then, an historic and very cold upper level low slid down the coast from British Columbia, driving snow down to sea level from Crescent City to Santa Cruz to Ventura County during late February. For flatlanders who missed the snow, hailstorms and graupel accumulated below intense cloudbursts. As it skimmed past the Bay Area and drifted toward the southern California coast, the cold cyclone exploded and entrained Pacific moisture up against mountain slopes. Several feet of record-breaking snow fell from the Sierra Nevada to south of the San Bernardino Mountains. The blizzards blocked mountain roads, buried buildings, collapsed roofs, and trapped residents for days in their mountain homes. Resorts from Wrightwood to Big Bear had never experienced such snowfall that more resembled Mammoth during its snowiest winters. Sierra Nevada snowpacks had grown to monumental heights, well more than ten feet (3 m) at some of the lowest elevations and southerly locations on record. Scientists and media stories reveled over the unprecedented stored water content. (Compared to our highest elevations, there are far more extensive California landscapes around 4,000-6,000 feet; cover them with thick snow and we are talking about millions of acre feet of water.)
After the first week of March, patterns switched back to deliver more atmospheric rivers aimed at central California, this time carrying subtropical air masses. Warm downpours on top of those record low-elevation snowpacks and already saturated soils combined to produce catastrophic flood scenarios. This state plagued by epic drought was suddenly experiencing billions more dollars in deadly flood damage. Hydrologists and water managers across the state were faced with the nightmare dilemma of letting the precious water flow to the ocean before losing all flood control capabilities or saving rising water in reservoirs so it might quench our summer drought later in the year. During the peak of the storms, multiple deluges stranded more than 17 million people under various flood alerts. Heavy rain fell where residents were just blowing piles of snow off their roofs to keep them from collapsing under the weight. At lower elevations, entire farms, neighborhoods, and towns went under water (such as in the Central Valley and in Monterey County along the Pajaro River) as levees were breached and other infrastructure collapsed.
The first days of spring brought yet another onslaught. A deep low pressure system intensified into a classic bomb cyclone spinning just beyond the Golden Gate. Winds topped 80 mph along the coast from the Bay Area south and up to 100 mph in adjacent highlands. The combination of low pressure, cold air aloft, and early spring surface heating even spawned a few damaging funnel clouds. An F1 tornado touched down in Montebello in L.A. County. Mountain snow piled higher. As if in some kind of late-season competition, yet another monster middle latitude cyclone swept out of the Gulf of Alaska and circulated across the state in late March. In the San Joaquin Valley, parts of Tulare Lake reappeared across its natural basin that had been drained long ago to make way for farmlands and settlements that were now suddenly submerged. That’s where we stood as this story continued to develop near the end of March. Here, we track (in photos, satellite images, and weather maps) some of the most impactful and bizarre weather patterns that make the 2023 rainy season so exceptional.
Figure 2. Red Sky at Night…? This winter will be no sailor’s delight. Such high ice-crystal cirrus clouds often appeared just to tease during the historic megadrought. But not this season. These November sunsets often warned of approaching warm fronts ahead of building Pacific storms that would soon soak and then inundate the Golden State.
Page One covers the January atmospheric rivers. Click to Page 2 to follow February’s record cold snaps and snowstorms. Then, we transition into the incredible return of atmospheric rivers in March. Images and their essay captions are in chronological order, covering nearly three months. They are arranged so that the curious can quickly breeze through them. More serious researchers and atmospheric scientists might use them as springboards to speculate how these exceptional weather patterns were switched on and locked in place, switched off, and then on again. Our story ends with some precipitation totals, dramatic videos of historic flooding, and a memorable quote that could apply to all of us. You will also find a link to a more detailed, comprehensive summary exploring the impacts on our water projects and a look into our possible weather and water future.
Figure 3. Moistening up for the Big Shows. By early December, there was a sense that dry weather patterns had been broken as middle latitude cyclones repeatedly swept off the Pacific. A mix of high, middle, and distant lower clouds signal that the air columns are loading with moisture before the next storm moves onshore.
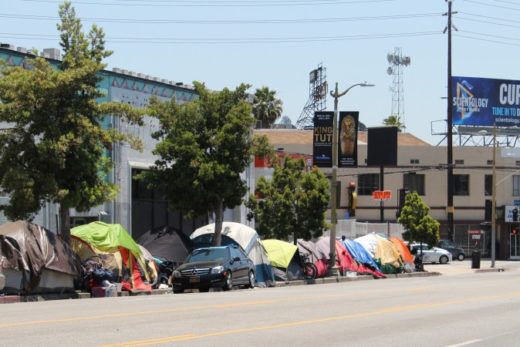
Figure 4. Seattle Weather Shifts to California. Dark clouds and occasional showers interrupted and moistened outdoor events across the state, such as this CycLAvia in South Los Angeles in early December. Avid bike riders braved the threatening overcast and showers, unaware that historic storms would follow.
Figure 5. The Storm Door is Open. Dense lower stratocumulus clouds following the last storm and thick high cirrus formations streaming ahead of the next storm became common sights during December. As unstable disturbances swept off the Pacific, they had plenty of deep moisture to work with.
Figure 6. Putting on a Show before the Really Big Show. By late December, such orange and red sunsets had become common sights between storms. Here, the setting sun shines on the bottoms of altocumulus clouds. The atmosphere has already filtered out shorter wavelengths of ROYGBIV so that only longer wavelengths of red, orange, and yellow remain.
Figure 7. Weather Signposts. These altocumulus clouds aligned themselves with mid- and upper-level wind patterns. They formed along the southern edges of late December storms soaking northern California.
Figure 8. Waterworld Invades California. Moist air masses help display wavy vertical patterns forming above increasingly unstable stratocumulus. A wet December transitions toward a wetter January.
Figure 9. Protection from Natural Cycles. By early January, it was evident that flood control infrastructures across the state might be tested as a series of relentless storms charged off the Pacific. This debris basin at Rubio Wash is at the base of the San Gabriel Mountains. It was completed in the 1940s. Before the worst of the storms hit, it was classified as a “high potential hazard” since it protected dense downstream populations from dangerous floods and debris flows. But it was also assessed in satisfactory condition. We will revisit this structure in March (later in this story) to see if it did its job.
Figure 10. Squeezing out the Water. When January’s atmospheric rivers streamed off the Pacific, they encountered our steep mountain ranges. The moist air was forced to rise up windward slopes and cool to its dew point. As clouds condensed and thickened, they dropped copious amounts of precipitation that accumulated to more than 10 inches during the largest single storms.
Figure 11. Coming Ashore. Sprawling middle latitude cyclones, such as this one on January 4, strengthened as they tapped into atmospheric rivers. As they approached California, they fed off air masses with very high dew points and precipitable water (all the water that could be drained out of an entire air column from top to bottom). Counterclockwise circulation advects warm, moist air up from the southwest on the front (east) side of the storm while cold unstable air sweeps down the back (west) side. Source: NOAA/National Weather Service.
Figure 12. Transporting Water by Air. In this water vapor image, we watch the same low pressure system deepen as it draws in warm air ahead of it and cold air behind. When it hits California, heavy rain, mountain snow, and high winds on saturated surfaces begin a flood and storm damage cycle that would repeatedly challenge Golden State infrastructures through March. Source: NOAA/National Weather Service.
Figure 13. Are these puffy clouds mimicking the sea foam or vice versa? Trains of cumulus clouds stream ashore in the cold, moist air following a frontal passage. The storms churned up ominous, sometimes damaging surf along our beaches. This relatively harmless sea foam forms along surf zones when organic matter is agitated by highly energetic crashing waves.
Figure 14. Waves in the Atmospheric River. By January 7, a series of short waves were guiding relentless storms into California. Source: NOAA/National Weather Service.
Figure 15. The Moisture Door is Open. One storm after another streamed west to east across the Pacific, directly into the Golden State. This January 7 water vapor image displays how each low pressure system attracted abundant moisture that would be wrung out, especially when the air masses passed across California mountain ranges. Source: NOAA/National Weather Service.
Figure 16. Predicting the Deluge. National Weather Service forecasters anticipated the storms. This 500mb chart illustrates how the early-to-mid-January atmospheric rivers transported moisture and turbulence directly across the Pacific. Troughs in the upper airflow pushed a series of surface cyclones from west to east, full speed ahead. Source:National Weather Service/NCEP/Ocean Prediction Center.
Figure 17. Rain Trains. Migrating shortwaves in the upper air flow guided these surface cyclones across the Pacific and into the state. Each storm arrived with its own characteristics and sweeping frontal systems. Their combined precipitation switched the state from drought to flood mode. Source: NOAA/National Weather Service/Ocean Prediction Center.
Figure 18. Rivers in the Sky. Atmospheric rivers (such as seen here on January 9) repeatedly organized and continued dragging moisture from west to east with individual storm systems. Source: NOAA/National Weather Service.
Figure 19. Starting to Look Familiar? Circulating counterclockwise, each storm concentrated moisture and energy to drive atmospheric rivers inland, first against the coastal ranges and then the Sierra Nevada. Source: NOAA/National Weather Service.
Figure 20. The Moisture Parade Continues. Featuring deep low pressure systems barely separated by weak ridges, the west-to-east march continued into mid-January. Storm door open became an understatement while rain suddenly became a feared four-letter word. Source: NOAA/National Weather Service.
Figure 21. Troughs Deepen at 500mb. The series of upper-level troughs and ridges often continued drifting off the Pacific and over the West Coast, migrating across the continent, and dragging surface weather patterns with them. Source: National Centers for Environmental Prediction, Weather Prediction Center.
Figure 22. Sending our Storms toward the East Coast. This surface map shows yet another January cyclone coming ashore with an occluding front. Many of our storms would be guided across the U.S., eventually powering deadly tornadoes in the south and blizzards in the upper Midwest. Source: National Centers for Environmental Prediction, Weather Prediction Center.
Figure 23. Impacting the Entire State. As the cyclone drifted across the state, it pivoted into a negative tilt, sweeping a cold front all the way toward the Mexican Border. The center of low pressure spins off the north coast as flooding lowland rains and several feet of mountain snows accumulate along California’s windward slopes. Source: NOAA/National Weather Service.
Figure 24. Atmospheric River Just Keeps on Rolling. On the same January 10 date in this water vapor image, we can see one storm passing through. But out in the Pacific, yet another atmospheric river stream organizes and aims at California. Source: NOAA/National Weather Service.
Figure 25. Looking for Breaks in the River of Atmospheric Water. By January 14, we notice yet another familiar repeat. The mother low spins off the north coast, circulating more moisture and instability through California. Source: NOAA/National Weather Service.
Figure 26. Sending more Upper Waves across the Continent. By mid-January, a series of migrating upper-level troughs continued to direct our storms over the state and then carry them across the continent and even into the Atlantic. Source: National Centers for Environmental Prediction, Weather Prediction Center.
Figure 27. Familiar Nimbo Skies. During mid-January, these scenes had become common along coastlines from north to south. As moist, unstable air masses were forced up mountain slopes, they dumped copious amounts of precipitation. However, an interesting and relentless pattern often kept nature’s firehose centered from just north of the Bay Area down through Central California and then across the Sierra Nevada.
Figure 28. Stubborn Patterns Persist. By January 15, water vapor images, incredibly, continued to display atmospheric river weather patterns. By mid-January, Big Basin in the Santa Cruz Mountains had accumulated more than 50 inches of rain and Sierra Nevada snowpacks were well over 10 feet. And just to prove the power of orographic precipitation and rain shadows during atmospheric river events, Death Valley had only received 0.26 inches of rain by then, while other desert valleys were almost as dry. Source: NOAA/National Weather Service.
Click on Page 2 to follow the next dramatic weather patterns, images, and videos that will guide you through the remainder of our winter of 2023.