Wind is all around us, constantly playing an essential role in life across California and on Earth. But what is wind and what forces are responsible for moving the tons of air that become gentle beneficial breezes or destructive deadly windstorms? Why are our transitions between seasons so frequently punctuated by windy periods?
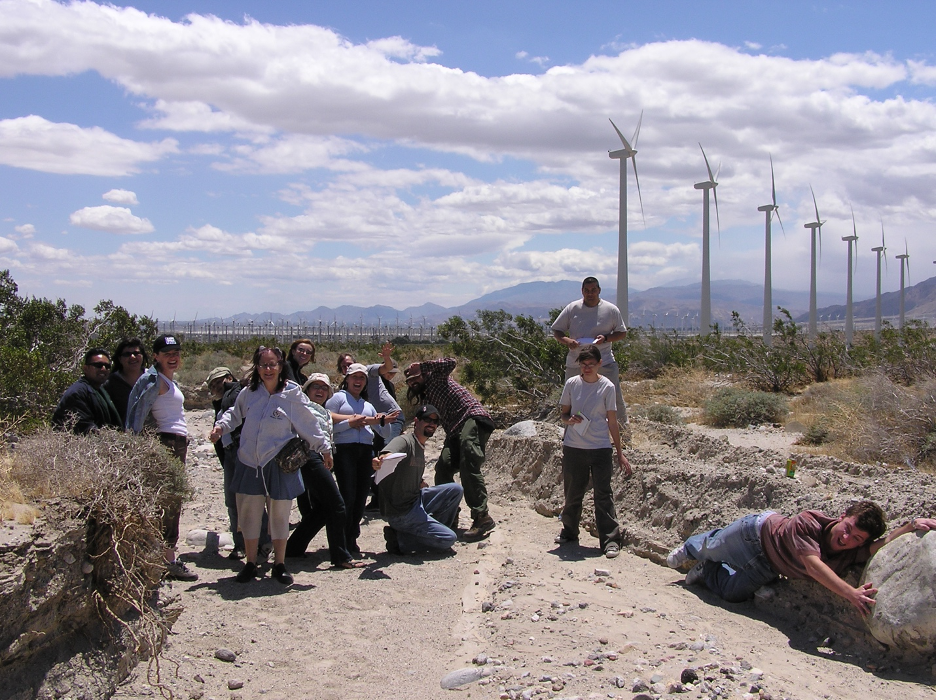
Comedy Relief from the Gales. Students in my spring semester field class (from years ago) braced themselves to withstand the gusts that deform creosote and other plants and spin massive wind turbines. San Gorgonio Pass performs as a classic natural wind tunnel when onshore breezes must squeeze through this narrow gap to finally flow farther inland and into the desert.
It’s invisible, underestimated, misunderstood, and often taken for granted. It transports and directs air masses, storms, moisture, clouds, smoke, dust, and sand. It glides over ocean and lake surfaces, generating waves (see our earlier website story about waves). It spreads pollen that helps propagate plant species and carries odors that animals must follow for survival. Insects, birds, and planes must fly into and through it. It can set the day’s moods: refreshing here, maddening there. It can nurture life and then destroy it in an instant. We could never give wind enough credit for rocking our world. No wonder we have assigned such colorful and descriptive names to winds common to Californians: Diablo, Santa Ana, Sundowner, Mono, Washoe Zephyr, Sierra Wave, Palmdale Wave, etc. … and even shared their stories on our website and in our book. The wind keeps us guessing with its wild mood swings and leaves us on the edges of our seats with its entertaining performances: swirling, dancing, rustling, whispering, singing, moaning, and howling, And then it vanishes and gives us the silent treatment.
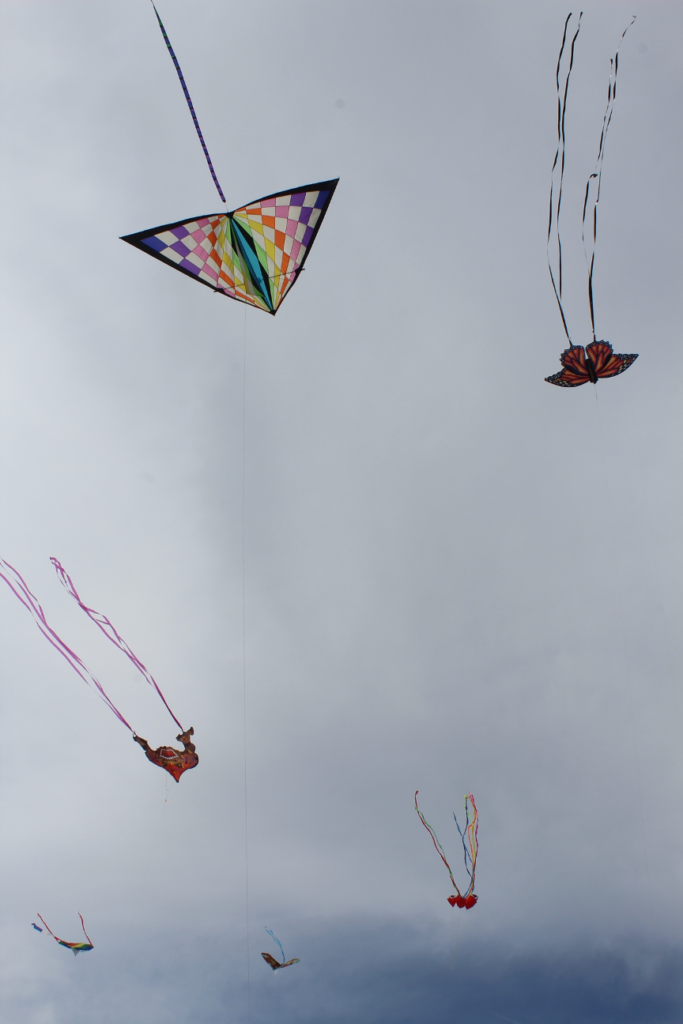
Billions of air molecules racing out of high pressure and into low pressure create the force you feel as wind. Stronger winds are capable of lifting larger and heavier objects, including some crafty kites.
How fast can winds blow across the Golden State? Recent records have been set, thanks to increasing wind speeds and our improved technologies to measure them. It is not surprising that records fall when strong currents are forced to skim over the state’s highest ridges and peaks, mostly in the Sierra Nevada. During the powerful atmospheric river that swept the state on February 4-5, 2024 (see our recent website story), a 162-mph gust was recorded at Ward Mountain (8,643 feet asl), above the Tahoe Basin. During the same storm, a 148-mph gust blasted across nearby Palisades Tahoe (8,700 ft) while a 125-mph gale roared past Mammoth Mountain. This was part of a massive and destructive windstorm that ravaged Northern California from the coast to the mountains, knocking out power to nearly one million people. Just weeks later, on March 1, 2024, a 190-mph gust swirled over Palisades Tahoe during the historic blizzard that is summarized in this story with weather maps. But none of these have yet eclipsed the NWS official 199-mph confirmed record set at Ward Mountain Palisades in 2017. Several records over 150-mph have been set on other peaks and ridges, but those above 8,000 feet looking down on the Tahoe Basin are the consistent Golden State winners. (California wind records can’t compete with the US wind speed winner: Mt Washington in New Hampshire at 231-mph.)
We all share memories of how windstorms interrupted or changed our lives when the gusts reshaped landscapes and damaged infrastructures around the places we call home. My mountain neighbor Steve Chadwick, who also spent ample time living in the desert, reminds me how windstorms occasionally blow sand across Coachella Valley roads. He and other residents have watched several desert roads (Gene Autry Trail and Indian Canyon Drive are examples) disappear below the shifting sands. After each event, the buried roads-turned sand dunes must be closed until sand plows (think snow plows) clear the way. Up on the nearby mountain around Idyllwild, power is interrupted when windstorms knock branches and trees down on to utility lines. Today, power companies across California are busy year-round clearing branches and dead trees away from their lines that may threaten to ignite the next deadly wildfire. Still, life on Earth requires wind and Steve was also quick to remind me how tons of dust blown from the Sahara are essential to the health of the Amazon. Here is a fascinating NASA article that summarizes this discovery.
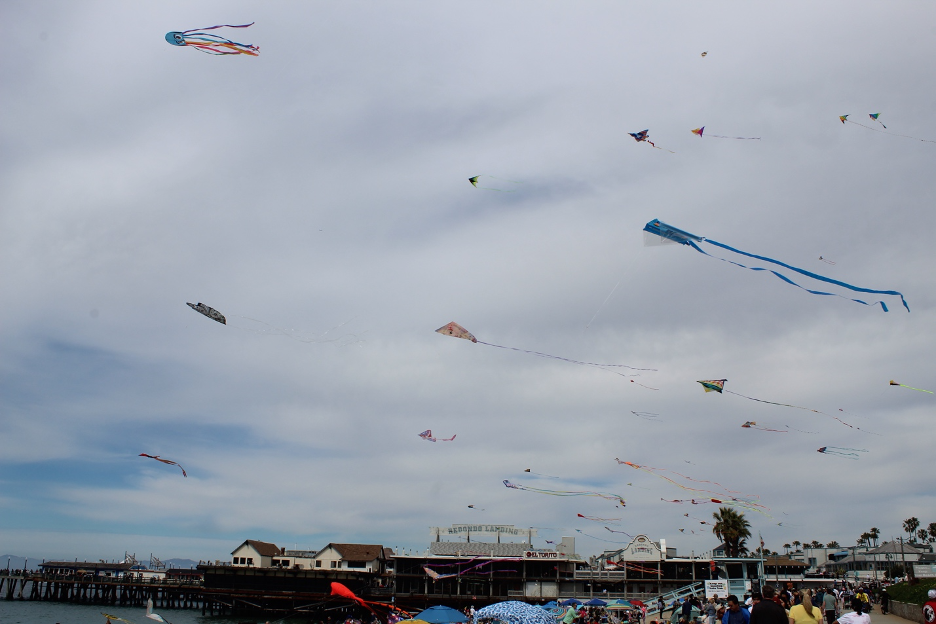
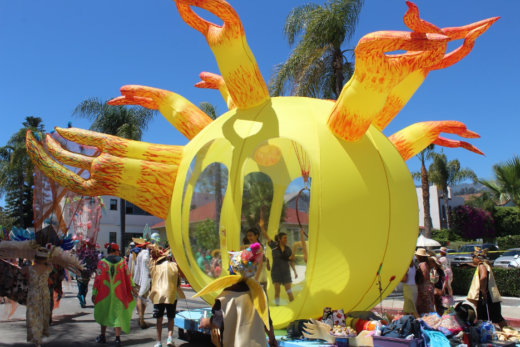
The annual Festival of the Kite decorates the sky around Redondo Beach Pier. Reliable sea breezes are expected during this March event with a 50-year history.
The big wind show starts with a pressure gradient force. Because wind always wants to blow from relatively high atmospheric pressure to low pressure (at the same altitude above sea level), air flows. The breeze or wind you sense is the force of billions of air molecules per cubic centimeter racing out of high pressure and into low pressure systems. When strong high- and low-pressure systems are positioned very close to one another, there is a steeper pressure gradient that will energize stronger winds. By contrast, when there is little or no difference between high and low air pressure around you, the wind will remain calm. Since pressure systems are constantly strengthening or weakening and migrating, wind velocities are always changing. The billions of air molecules you feel and breathe have likely traveled thousands of horizontal miles and thousands of vertical feet (or meters) to get to you. They are sailing messengers announcing how our dynamic atmosphere is fluctuating and what changes you might expect in the future.
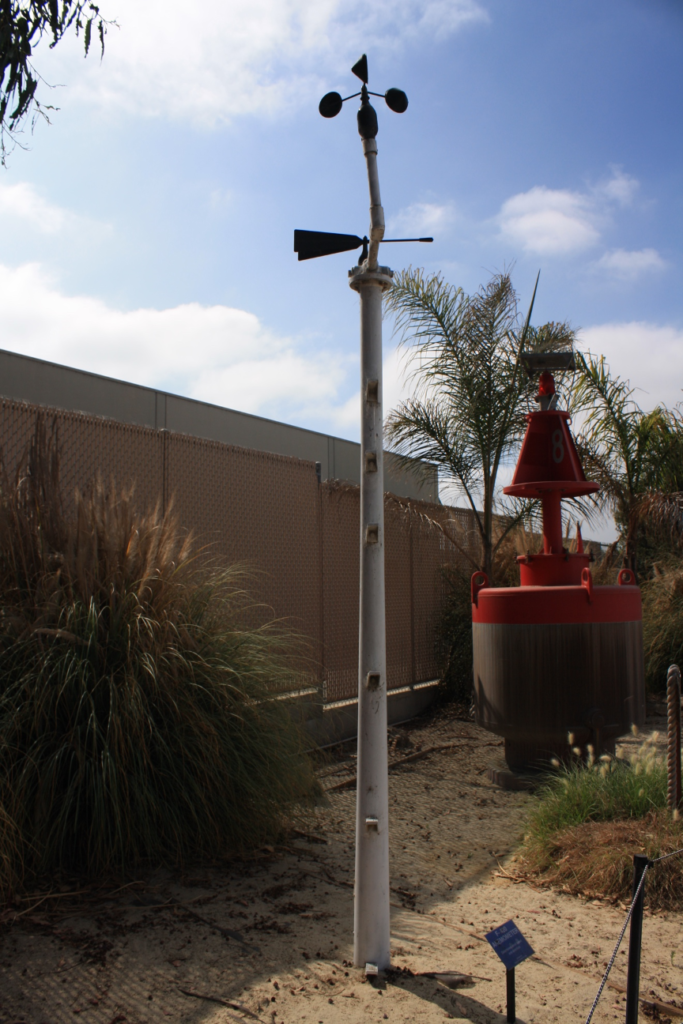
Traditional anemometers and wind vanes (measuring wind speed and direction) are on display behind the National Weather Service Office in Oxnard.
Because Earth turns under this air set in motion, the Coriolis effect will also kick in. The wind will be turned to its right out of high-pressure systems in the northern hemisphere and also nudged to its right as it flows into low-pressure systems. Add friction near Earth’s surface and the pressure gradient force will gradually win this windy tug-of-war. This is why winds spin clockwise out of high pressure anticyclones (fair weather systems) and counterclockwise into our northern hemisphere low pressure cyclones or storm systems. (Note that winds turn and spin in opposite directions when pouring out of highs and into low pressure systems in the southern hemisphere.) Looking for more details about these pressure patterns and winds? Check out the weather maps at the end of this story and then our new California Sky Watcher publication.
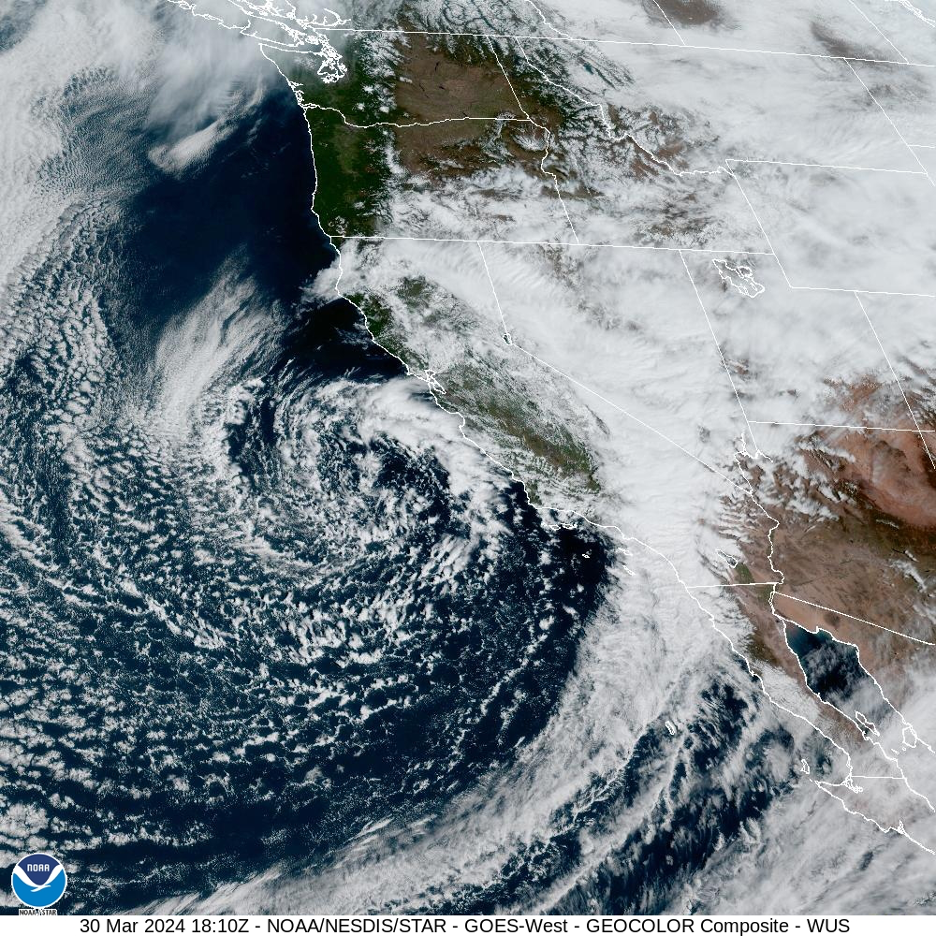
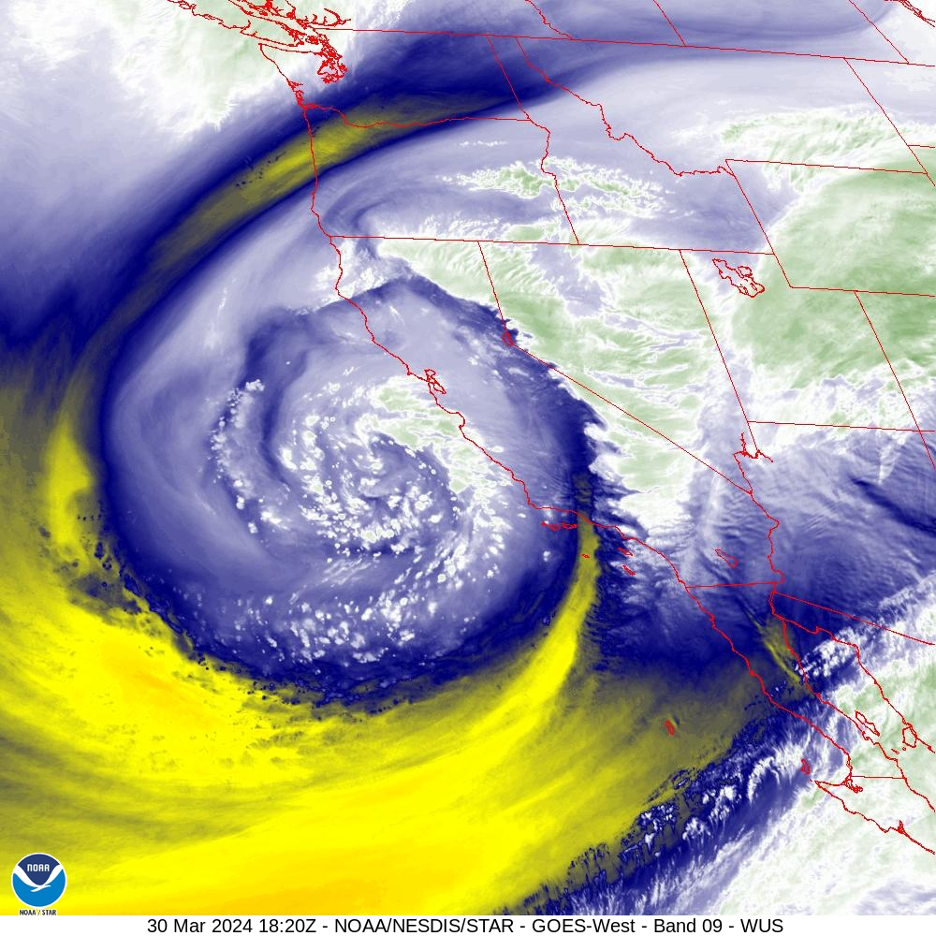
Cloud patterns indicate wind directions as this March 30 storm spins down the California coast. Note how winds circulate counterclockwise into the cyclone, which is centered just south of the San Francisco Bay Area. Southwest winds over wet and stormy Southern California turn more southerly over the Sierra Nevada and then continue turning until they flow out of the east and offshore in northern California. Far to the left and offshore, on the west or backside of the low, cold air spins down from the north, then turns around the low pressure toward California. Source: NOAA/National Weather Service.The same cyclone is seen in this water vapor image. The pressure gradient force pulls the air toward the center of the low, but the Coriolis effect constantly nudges the wind to its right, resulting in the characteristic counterclockwise circulation. Source: NOAA/National Weather Service.
There is much more to this aeolian story, but you can see why spring can be a breezy season. Extreme temperature gradients can bolster strong pressure gradients as warm summer air masses encroach upon winter’s stubborn cold air masses. Sporadically and unevenly, summer will win this annual war, but not without some windy battles. Additionally, as the longer days and higher sun angles rapidly warm inland land surfaces, the progression through spring encourages onshore breezes. Air will begin expanding and rising above those heated land surfaces, creating thermal low pressure there that will suck in the cooler, denser air that forms above our cold ocean currents. Sea breezes and their marine layers will begin to dominate weather conditions along the coast well into summer. Mountain barriers represent massive blockades, except for the few canyons and passes that become narrow wind tunnels where coastal air masses attempt to squeeze inland. You will find some of our largest wind turbines – producing energy for millions of Californians – aligned within these natural air vents.
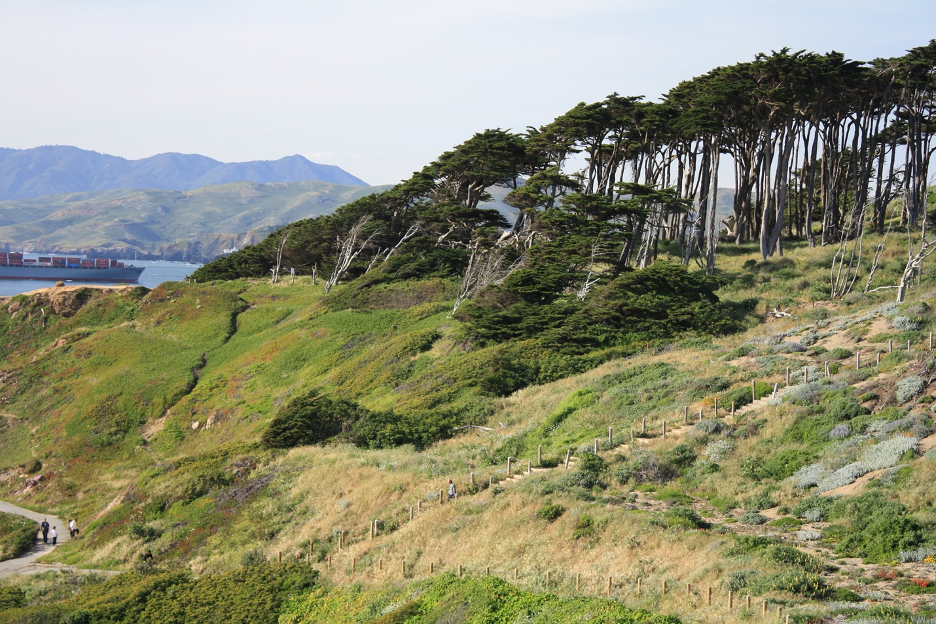
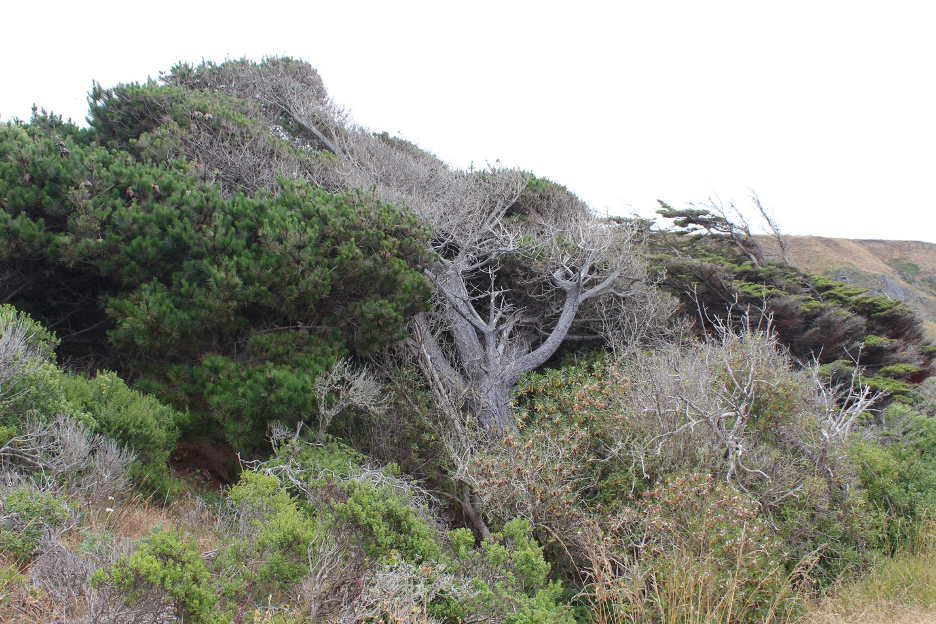
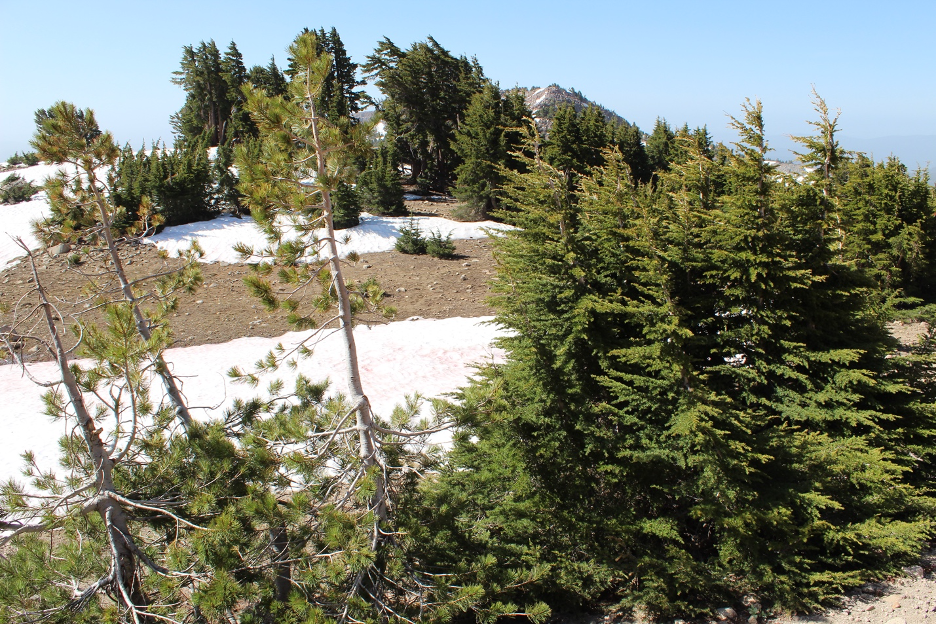
The windiest regions in California are often where mountains interrupt the wind flow patterns, especially through mountain canyons and passes.If you spend some time on or around San Francisco beaches, you know why these trees are deformed. Strong winds blast off the ocean and sculpt the vegetation most of the year, thanks to winter storms and summer pressure gradients that direct persistent sea breezes inland (from left to right).You will find abundant examples of how strong onshore winds carrying salt spray off the ocean are shaping and contouring plant communities along the Northern California coast. Prevailing winds blow right to left here from Goat Rock Beach, which is just behind us and to our right. Here are deformed flag trees (AKA krummholz) sculpted by the wind near Lassen Peak. The volcano pokes up into relentless high-altitude winds that often blow from west to east (right to left here) during punishing winter storms. You will also find this image in our new book.
Continue with this developing photo essay as we demonstrate how wind shapes our world and how we can estimate wind direction and speed by looking up at the sky. We highlight some of the windiest episodes that ended the winter and continued into the spring of 2024. Conditions became particularly exciting at the end of this wet and stormy El Niño season, which threatened to complete the wettest two consecutive years in Los Angeles history. If you are looking for more detailed meteorological explanations for all this air pressure and wind mania, continue to the final weather maps near the end of this story.
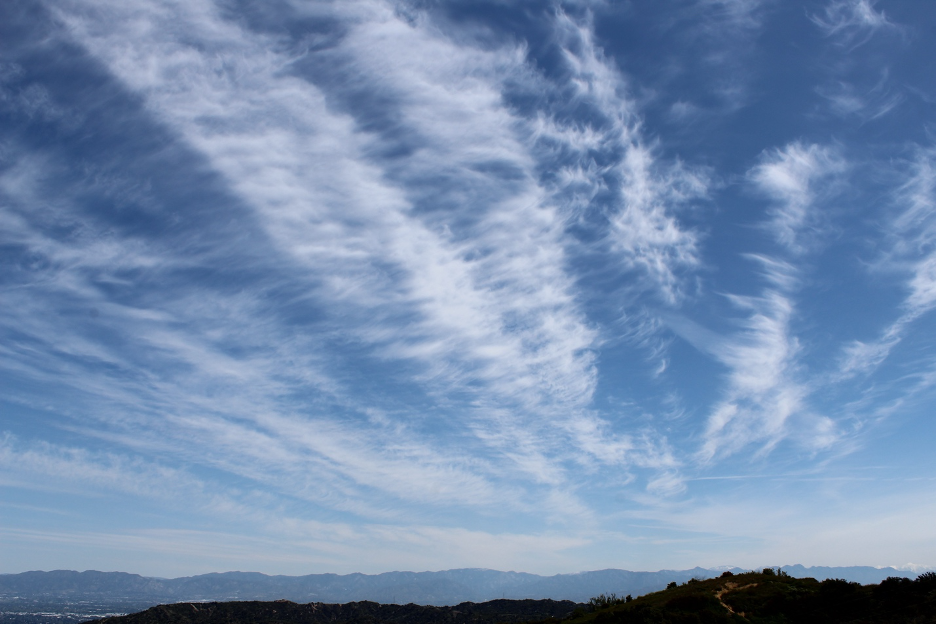
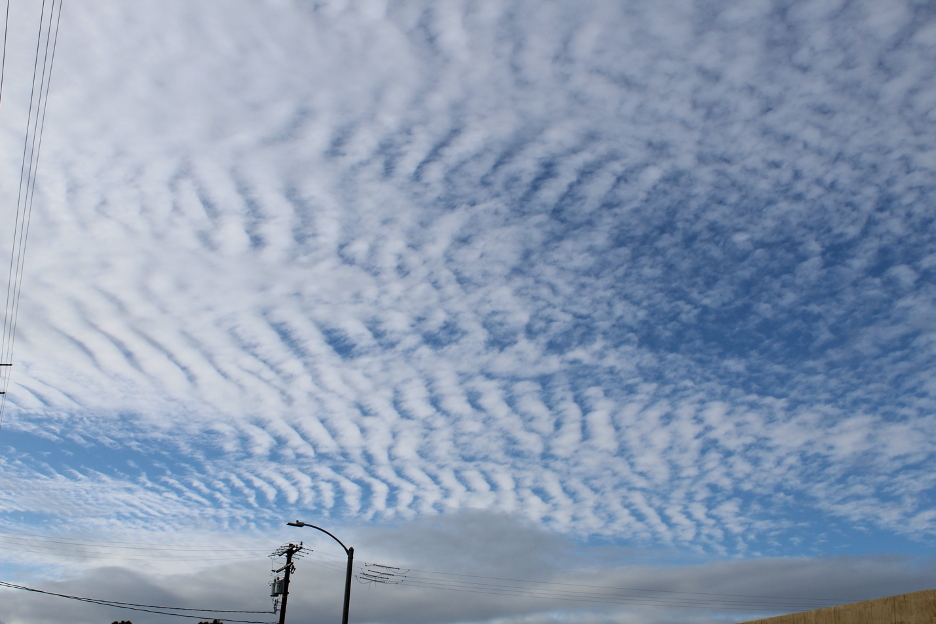
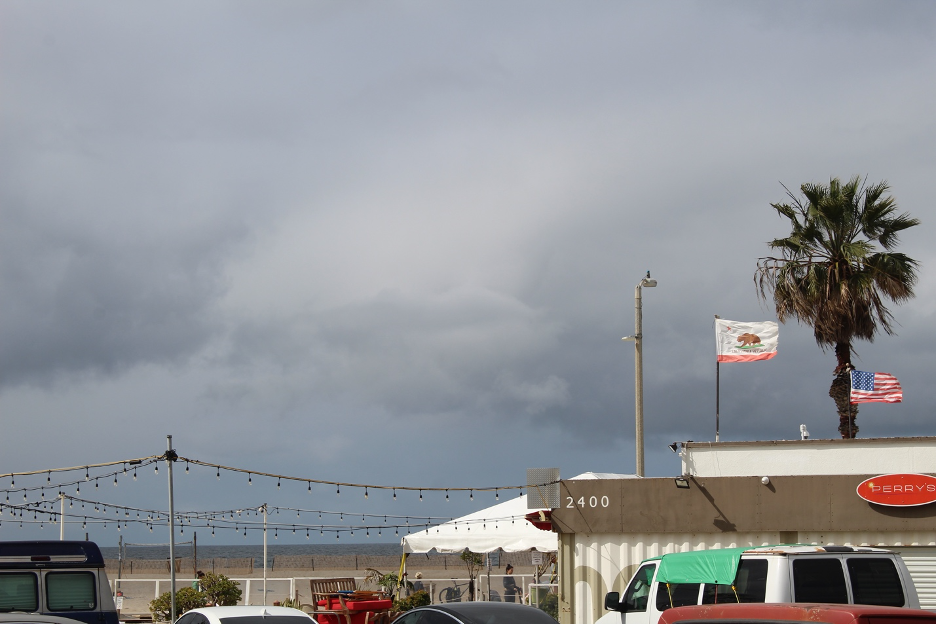
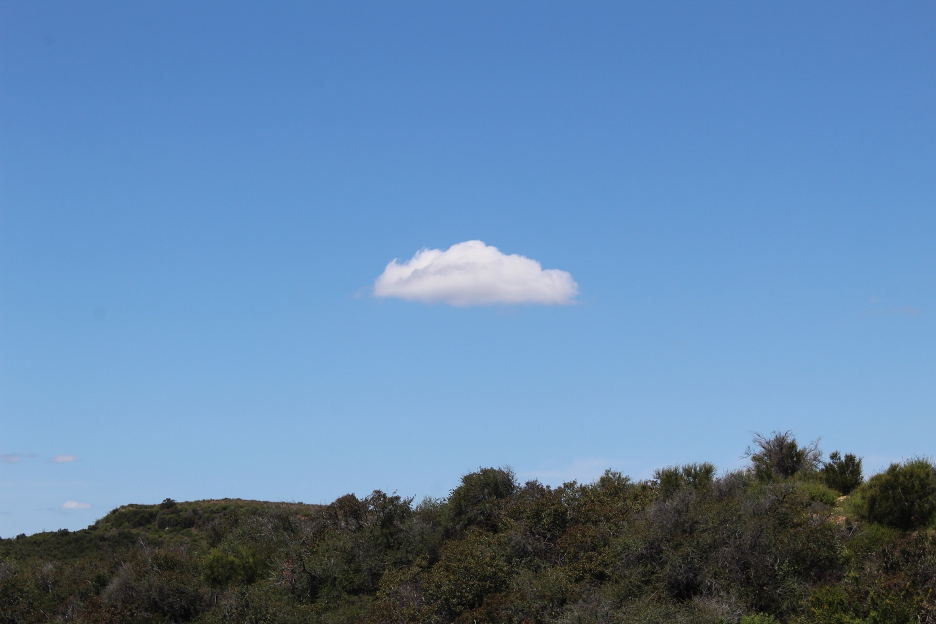
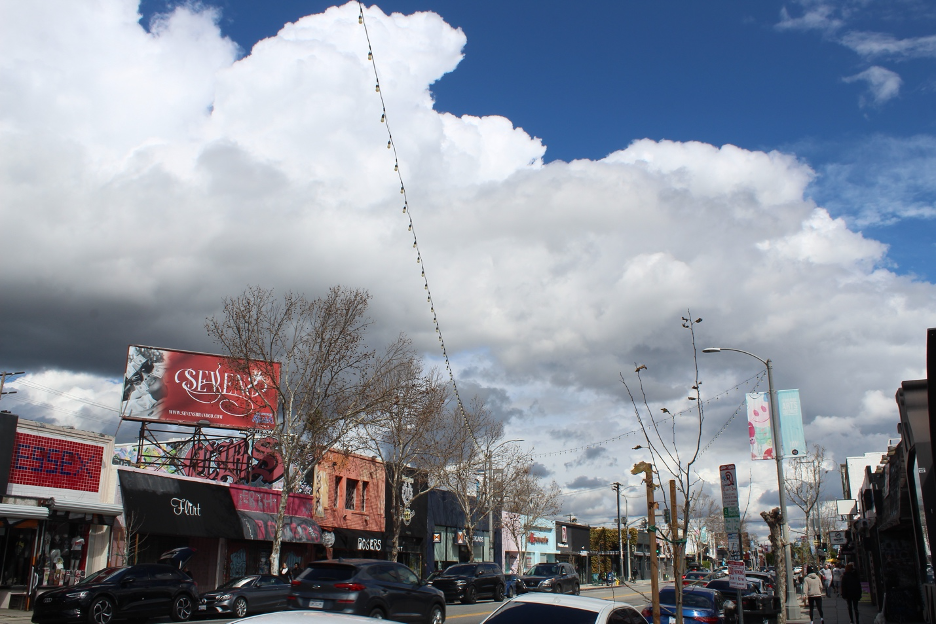
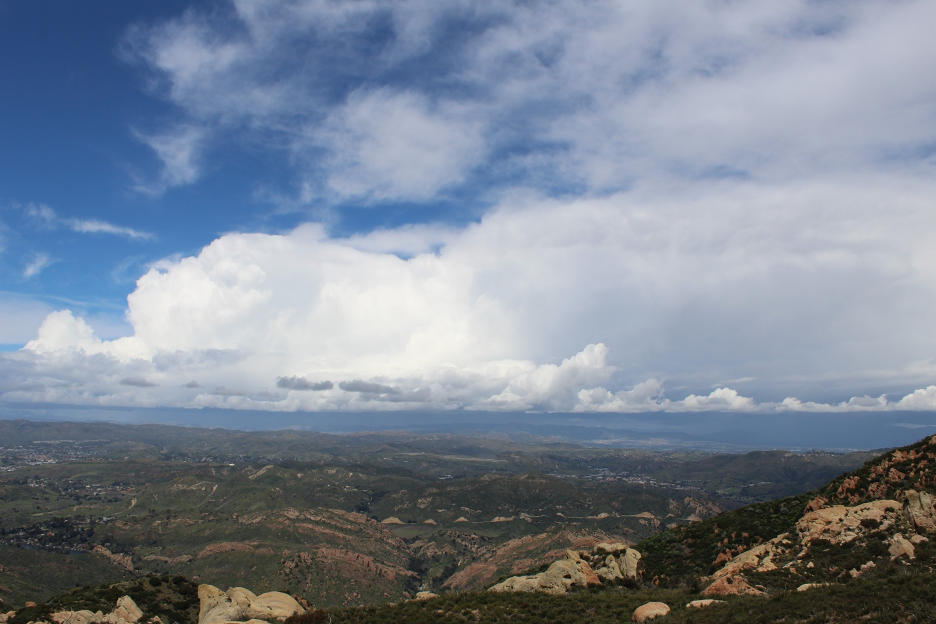
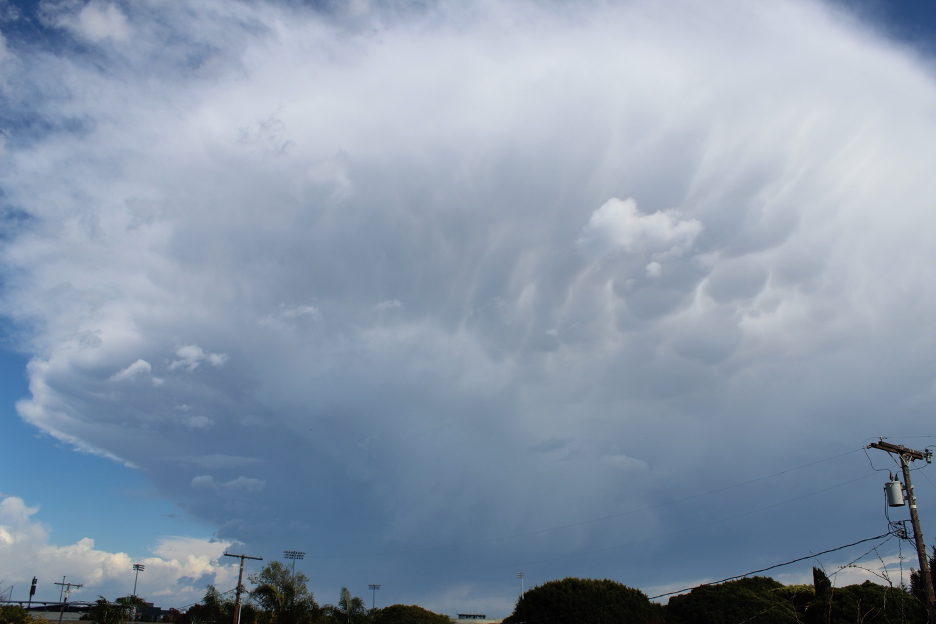
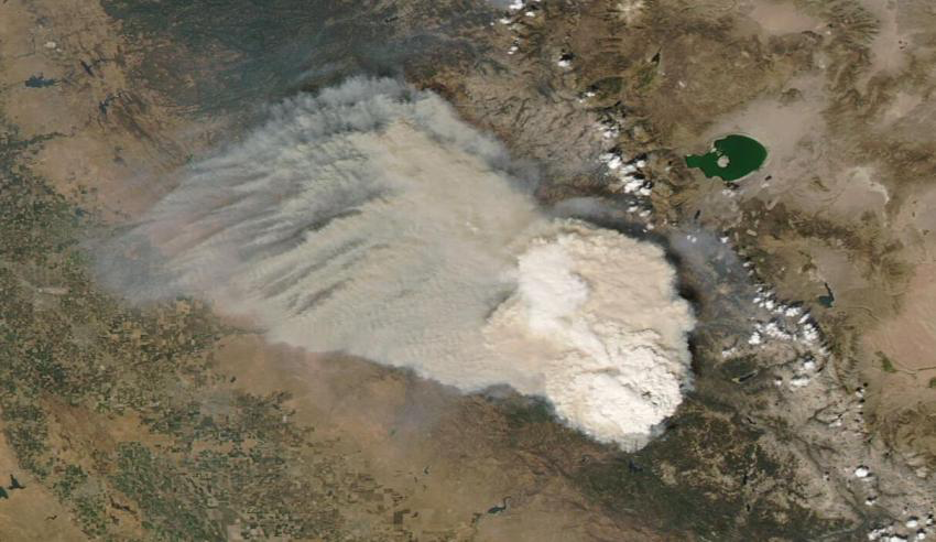
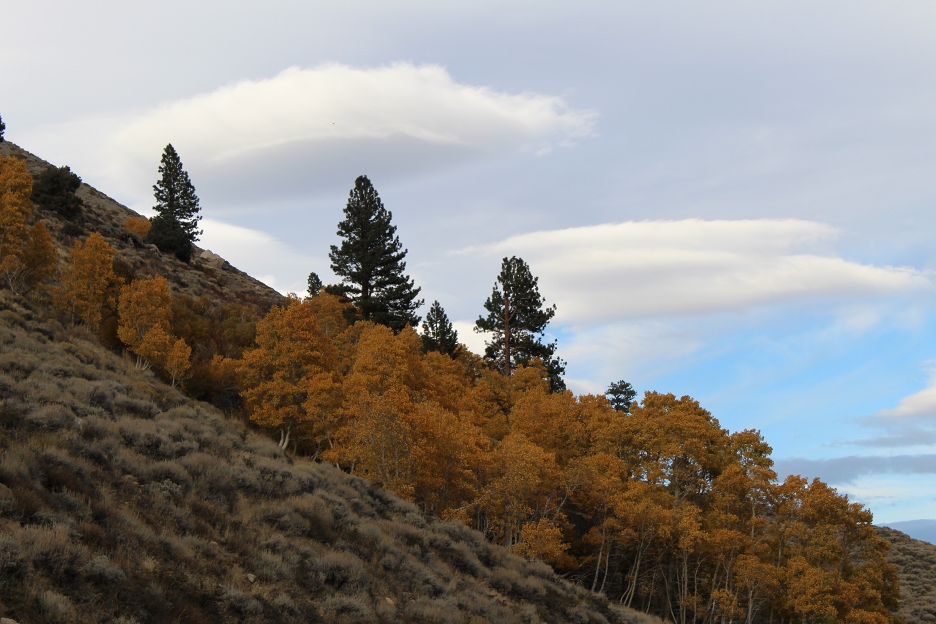
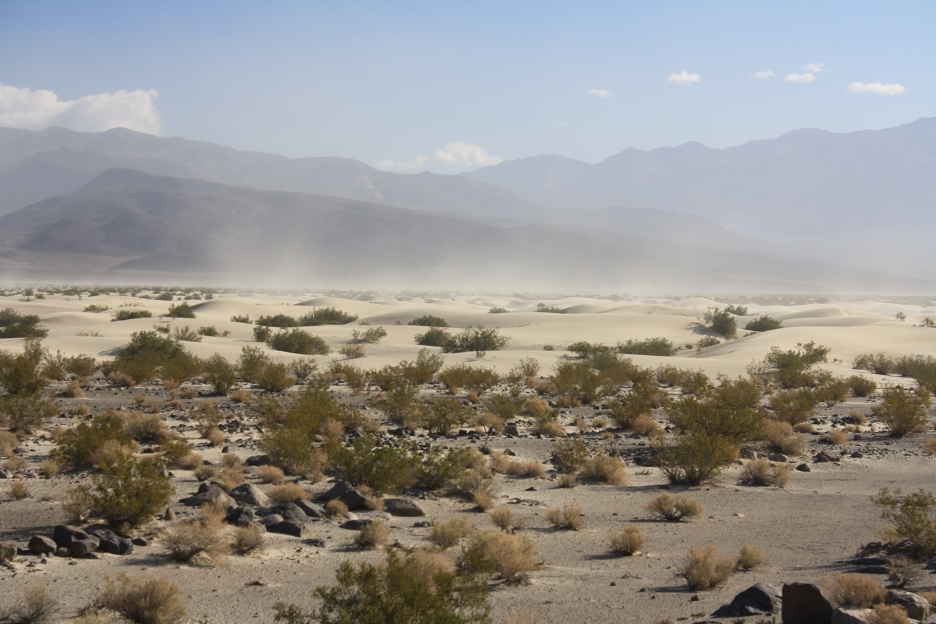
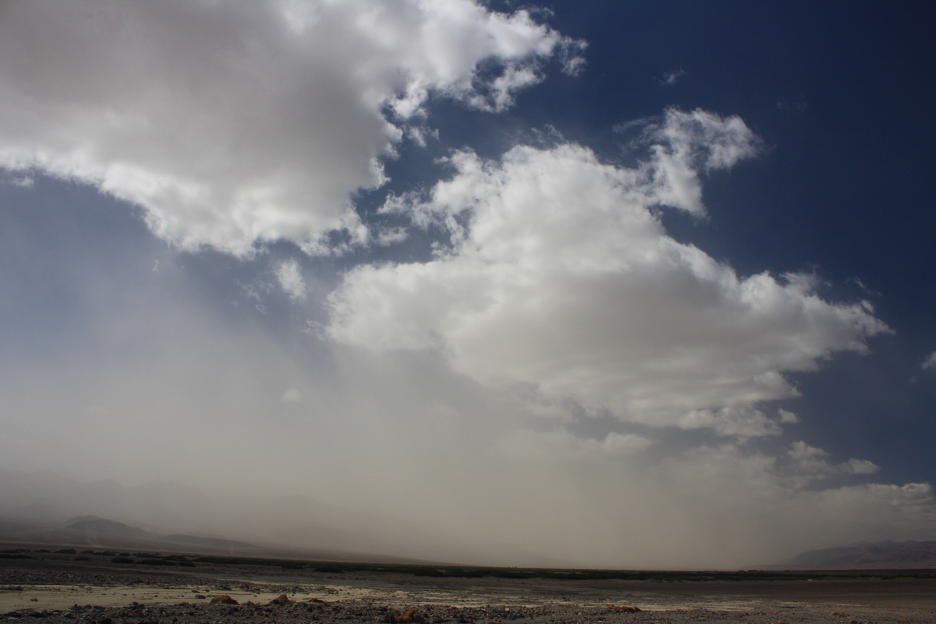
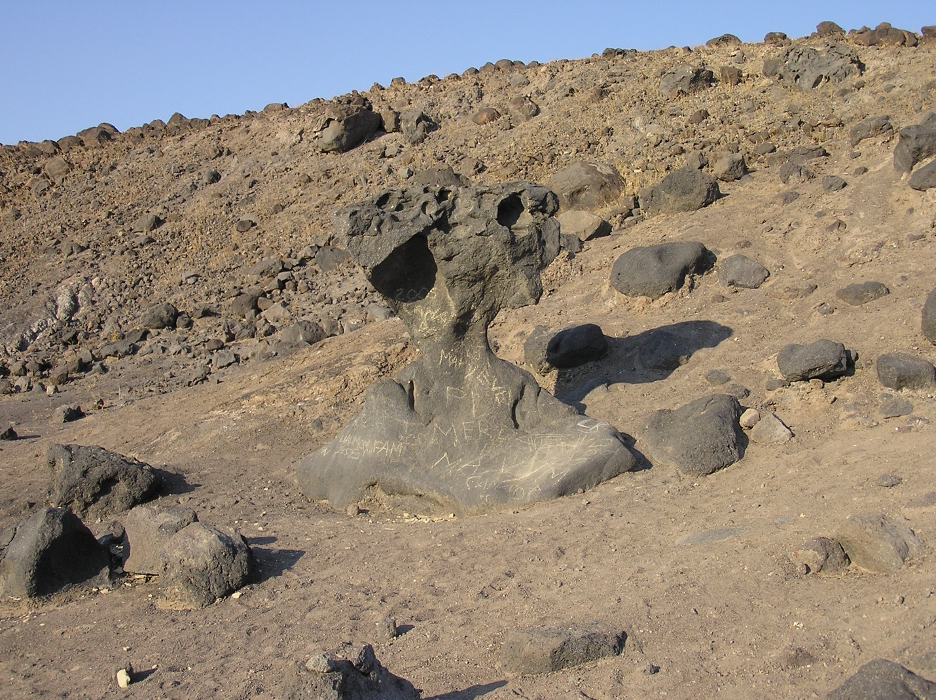
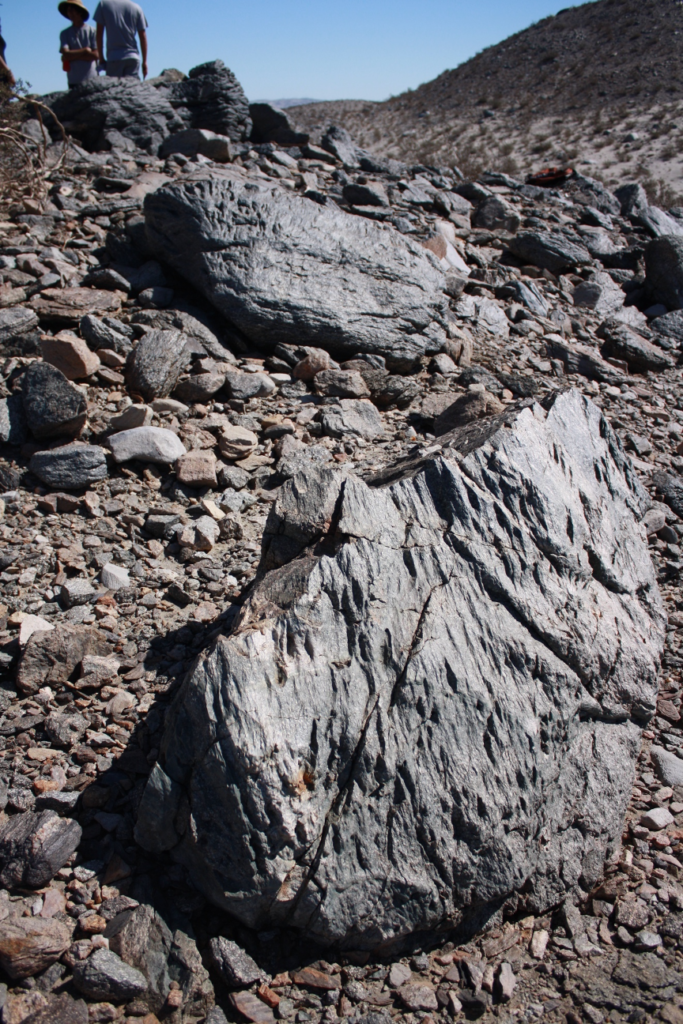
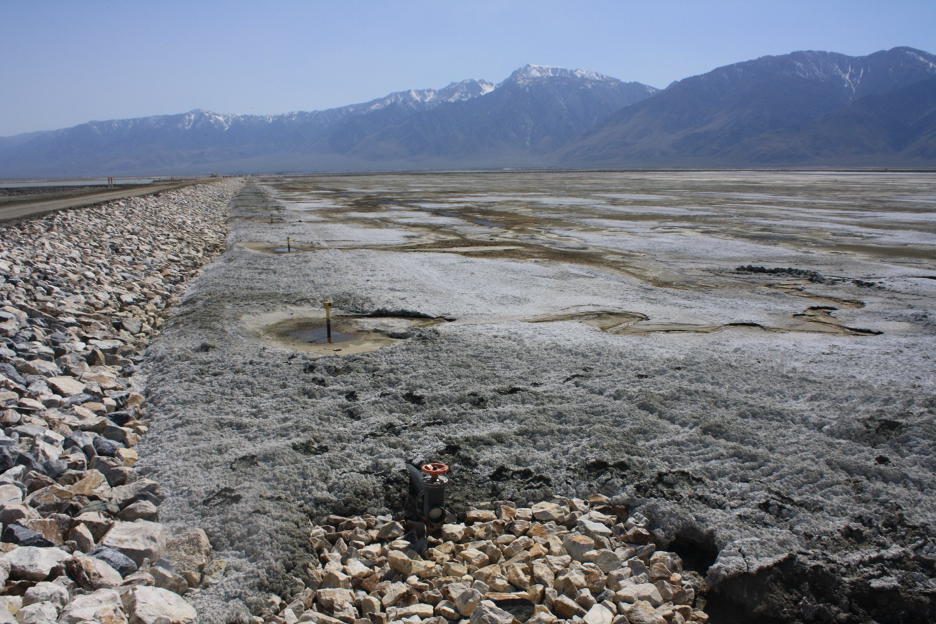
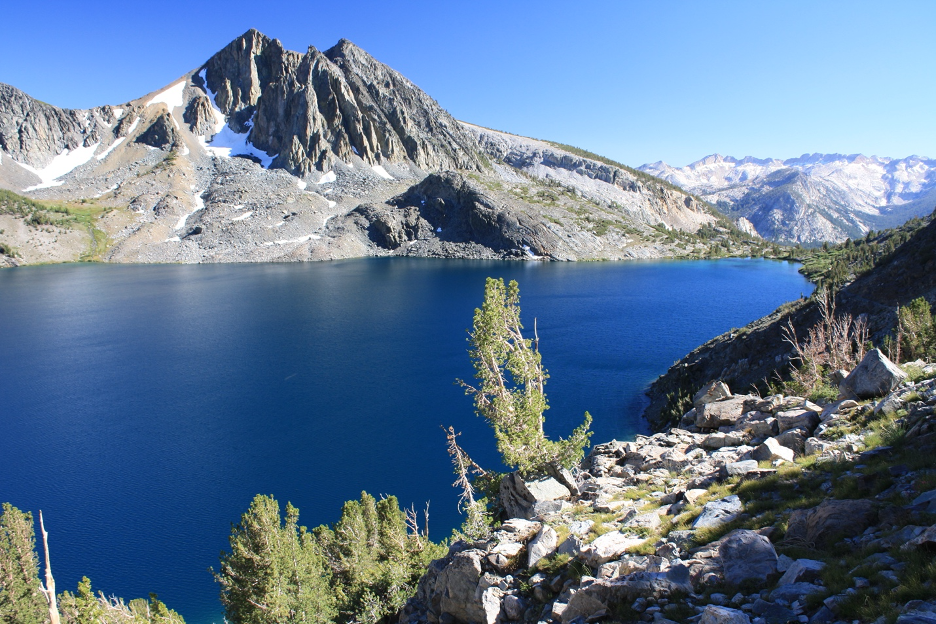
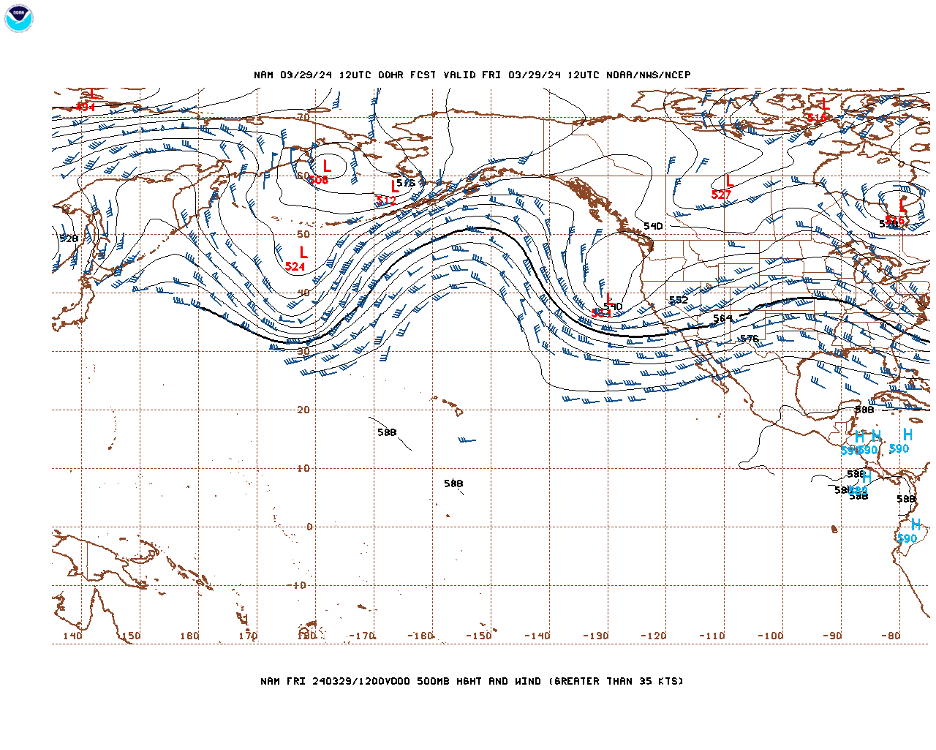
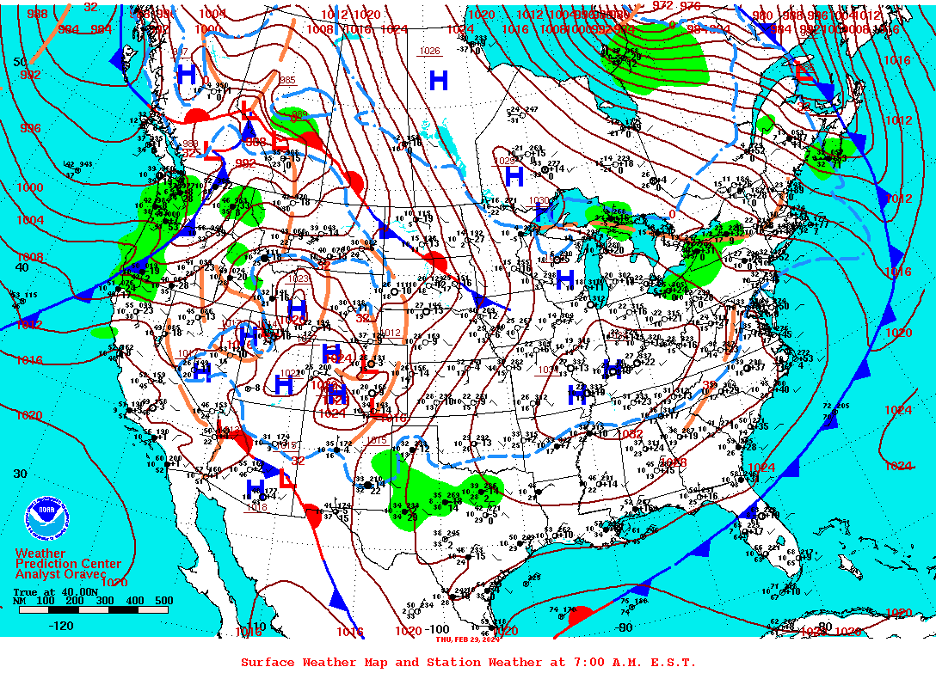
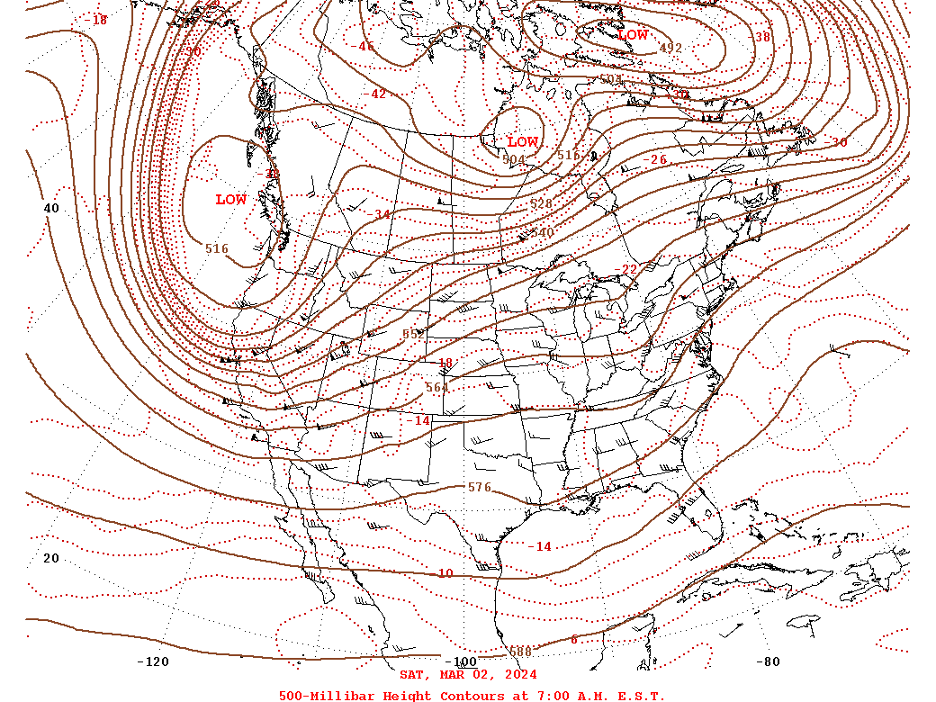
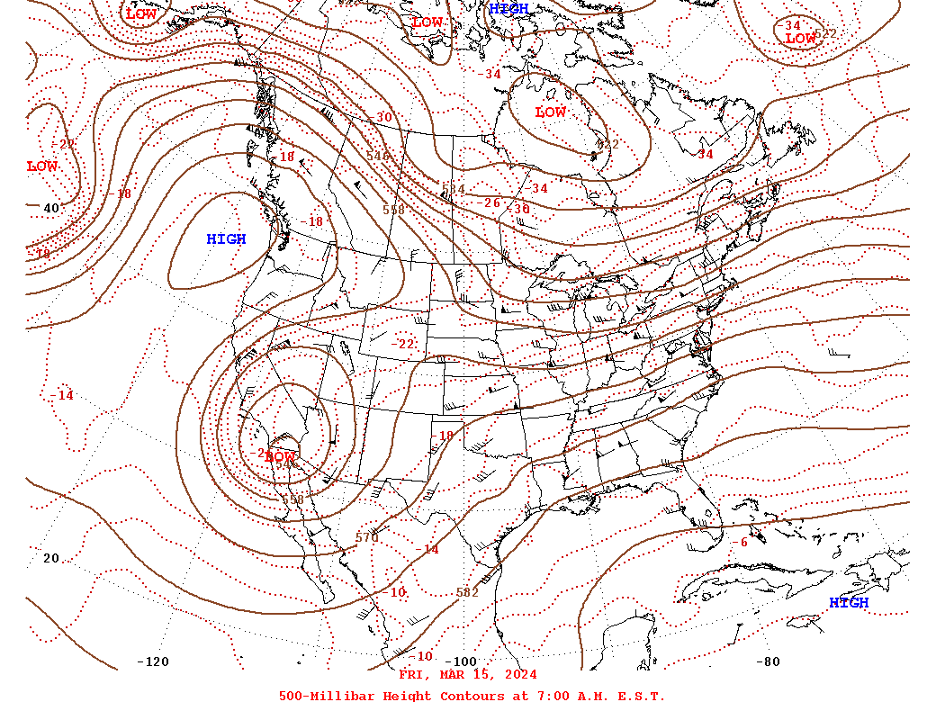
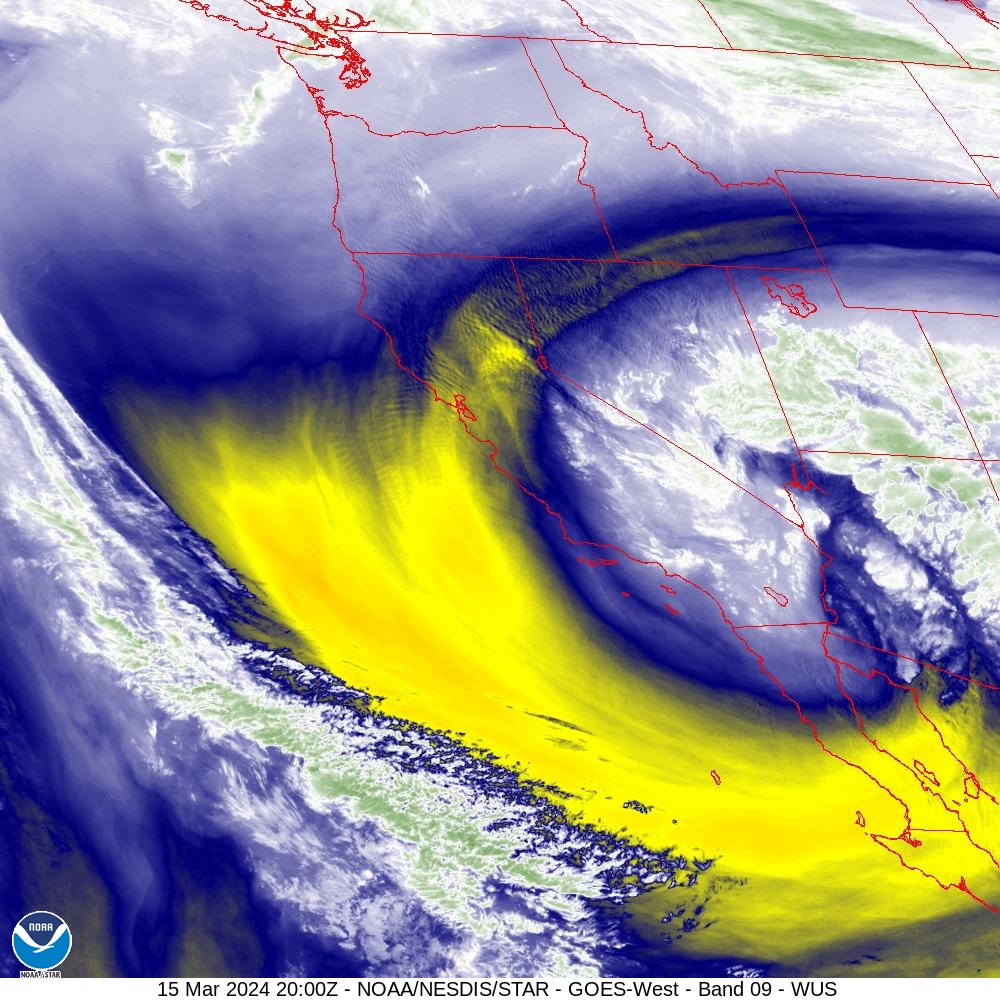
High cirrus cloud streaks are running roughly parallel to strong upper-level winds. The winds are blowing from west to east (from behind us and then over toward the distant mountains). Delicate ice crystals are caught in these winds that raced across the Pacific Ocean and now across the continent, traversing entire states within hours. Ribs of high cirrocumulus clouds form as upper-level winds flow left to right (west to east). The roller-coaster-like wind currents get bumped upward, where the moist air rises and cools to its dewpoint, creating a line of clouds. The air currents then readjust by sinking on the backsides (downwind) of each updraft, where the air is slightly heated by compression until the clouds evaporate in a line of clear air that marks the adjacent downdraft. Continuing further downwind, the air readjusts again, looping back upward to condense and form another line of clouds. Such up and down looping motions continue downstream to produce ripples (all aligned perpendicular to the wind) as the entire mass of clouds drifts along. Lower gray stratus clouds can be seen near the horizon. Today’s wind warns us that more rain is headed our way. Increasing clouds are streaming with the wind that is blowing from south to north (left to right) as shown by the flags and palm fronds. Seasoned weather observers know that winds circulate toward low pressure systems and that our storms usually approach from the North Pacific during our rainy season. We are looking toward the beach and ocean (on the horizon). Slightly moist air near the surface has been heated on this sunny afternoon to form local thermals (updrafts). This tiny fair weather cumulus cloud formed when air in one such narrow updraft was rising, expanding, and cooling to its dewpoint (saturation). The flat bottom marks the condensation level. There are plenty of sky watching opportunities in our cities, such as here along Melrose, the epicenter of hipster culture in LA. On this Easter Sunday, there is just enough instability and wraparound moisture lingering from an exiting storm system to form some towering cumulus clouds. Afternoon heating has further destabilized pockets of air that expand, rise, and cool to their dewpoints. Do you think the fashion followers on these streets were admiring the sky show and estimating wind velocities up there by watching the clouds boil up and drift along? By sunset, the afternoon’s updrafts collapsed within cooling air masses and so did the cloud towers, known as cumulus congestus.A moist, unstable air mass followed another late-season Pacific storm to produce local severe weather. As cold air moved over us from the Gulf of Alaska, the spring sun heated the surface, creating extreme lapse rates (the difference between temperatures at the surface and upper atmosphere). Rising air columns were given a boost when they encountered mountain slopes. As the boiling air cooled to its dewpoint, tremendous amounts of latent heat were released into the clouds, accelerating the updrafts. Giant cumulonimbus clouds (thunderheads) produced dangerous lightning, strong winds, heavy cloudbursts, and hail. You can see the storms boiling up over the distant mountains and their anvil tops shearing off and drifting toward the right with the upper-level winds.These mammatus clouds and visible downdrafts are the remnants of a thunderstorm, such as the ones that can be seen still forming on the far distant horizon and in the previous image. But this once-magnificent tempest of a cumulonimbus cloud is collapsing and dissipating. Its ice crystal anvil top is left to drift off the mountains and across the coastal plain, steered by upper-level winds.A towering cumulus cloud briefly boiled up into an isolated cumulonimbus in late spring’s afternoon desert heat over the mountains near Joshua Tree National Park. But moisture was cut off as dryer mid-level winds from the northwest sheared it toward the southeast. Only the remnant anvil top was left to drift over the Coachella and Imperial Valleys and toward Mexico, where sky watchers could estimate upper-level winds as they observed the innocuous remains of a storm that almost was. A summer afternoon thunderstorm is building over the mountains near Las Vegas, NV. It is typical of “monsoon” storms that occasionally break the summer heat in Sonora, Mexico and in the southwest US. Note how the cumulonimbus boils up on the left and middle of the image, but how middle- and upper-level winds shear the anvil top toward the right. But because the storm continues to build on the upwind side (a process meteorologists call back-building), it could remain nearly stationary on this day as winds billow up through it. This pyrocumulonimbus cloud (cumulonimbus flammagenitus) boiled up in the intense heat of the Creek Fire of 2020 in the Sierra Nevada Mountains. It was not only one of the largest fires in California history, but it produced this record-setting smoke cloud that poked through the troposphere. This historic fire also created its own weather and winds, complete with fire tornadoes. You can see how mid- and upper-level winds are pushing the smoke from southeast to northwest. Folks downwind suffered through the smoke attacks. Source: NASA Worldview. These wavy lenticular formations appeared within mountain waves downwind of our Transverse Ranges. Offshore winds contained just enough moisture so that, when forced over the mountains, the air cooled to its dewpoint when it ascended to the top of the wavy motions. Momentum encouraged the gentle upper-level roller coasters to continue meandering up and down out over the ocean in the relatively stable airflow that only resembled magic carpet rides. Flying-saucer-shaped lenticular clouds are more common over and east of the Sierra Nevada Mountains. You will notice them especially from fall through spring as high-velocity westerlies skim over the Sierra Nevada and carry east (downwind) across the Basin and Range. The lens-shaped formations remain nearly stationary in the upward loops of undulating winds that blow through them. Aspen trees can also be seen in their fall colors here above Twin Lakes. Here’s what a spring wind and dust storm looks like in remote Saline Valley, on the edge of Death Valley National Park. Weathered and eroded sand, silt, and dust is carried from the surrounding mountains, picked up and transported by fierce desert winds, and finally deposited in more protected basins where fields of sand dunes can accumulate. The size and shape of the dunes is determined by a host of factors that include the strength and direction of the winds, the nature of materials being blown around, and the local environment. A spring windstorm launches dust in Death Valley National Park. Raggedy clouds appeared in the marginally moist north wind as tiny water droplets condensed around suspended condensation nuclei. This ET-shaped ventifact (a rock polished and pockmarked by wind-driven sand) was a cherished landmark in Death Valley National Park until it was vandalized. Nature carved it into this hourglass shape as the largest grains of abrading sand can only be lifted just above the surface, even by the strongest winds. These ventifacts were blasted and sculpted by sand grains flying through the San Gorgonio Pass wind tunnel. As in many high deserts, Owens Valley has a high wind reputation. When the north wind blows like this, toxic salts can be lifted off dry lake surfaces and carried hundreds of miles. Mt. Whitney and the Sierra Nevada barrier rise in the background. After diverting so much water from Owens River and Lake, the LA Department of Water and Power has been forced to spend more than $2.5 billion to stabilize exposed toxic salts on the dried lakebed. During windy periods, salty poisons have been launched and carried great distances, spoiling air quality in the region. Far to the south, similar problems plague what remains of the Salton Sea. Winds are a constant threat to plants and animals at highest elevations in the Sierra Nevada. This summer scene looks nice, but winter gales that make it over these peaks and ridges blast shreds of ice in temperatures well below zero Fahrenheit. Animals migrate out or dig below the annual blizzards in their shelters; plants exposed above the snow depth are bent and tortured. This 500 mb map shows pressure gradients and winds about halfway up through our atmosphere. The blue barbs point into the wind (notice how they are aligned parallel) and the little lines or flags on them indicate wind speed. This map from late March demonstrates how upper-level (Gradient) winds will blow parallel to curved isobars (showing pressure trends) or height contours. Follow the meandering lines and winds as they race out of Siberia on the far left and continue to your right (east). They curve south below a low-pressure trough and then meander back up north over a high-pressure ridge as they cross the North Pacific Ocean. As they approach the west coast, the winds dip south again into a deep low-pressure trough just before flowing west-east over California. This pattern will push another late-season Pacific storm across California. Source: NOAA/National Weather Service.This surface map shows big changes sweeping into California during the final days of February, 2024. A strong cold front and low-pressure trough is encroaching from the northwest and crunching up against that massive high pressure over the western states. As the storm intensified and pushed into California, extreme pressure gradients generated damaging winds and historic blizzard conditions across northern California mountains into the first days of March. View the 500mb map that follows to see how the supporting upper-level trough intensified. Source: National Centers for Environmental Prediction, Weather Prediction Center.This 500mb map shows the deep upper-level trough that sagged down the West Coast in early March. This system generated historic intense blizzards that ravaged northern California mountains. Follow the parallel lines that will steer winds directly south from the Arctic and Alaska and then watch them turn around the bottom of the trough and right over California. It’s a cold, stormy period on the west coast. Source: National Centers for Environmental Prediction, Weather Prediction Center. A very different (March 15) upper-level map illustrates an unusual pressure and wind pattern over the western US known as a Rex block. High level winds are forced to meander north and over and around that high pressure ridge just off the Washington coast, then curve south and around that deep low-pressure trough over Southern California. This steers a strong northeast offshore flow over most of California. The stubborn pattern locked into place for a few days, bringing fair weather to Northern California and unstable weather to Southern California. But it was a windy period for the entire Golden State as those upper-level winds filtered down toward the surface, where pressure gradients were also steep. Source: National Centers for Environmental Prediction, Weather Prediction Center.Viewing down on this water vapor image, we can see winds rotating around the cutoff low shown in the previous weather map. The center of the surface low has stalled near the Colorado River and the CA/AZ/NV Triple Point. Source: NOAA/National Weather Service.
The wayward wind might be a restless wind, but it opens windows for us to sense the systems and cycles that rule in our natural world, beckoning us to explore and better understand the vital scientific experiments that nature conducts every minute of every day. Because we have just swirled around the edges of such a tempestuous topic during this brief summary, you might want to check out a new publication where we blow the lid off the many aeolian mysteries found on our third rock from the sun: California Sky Watcher.
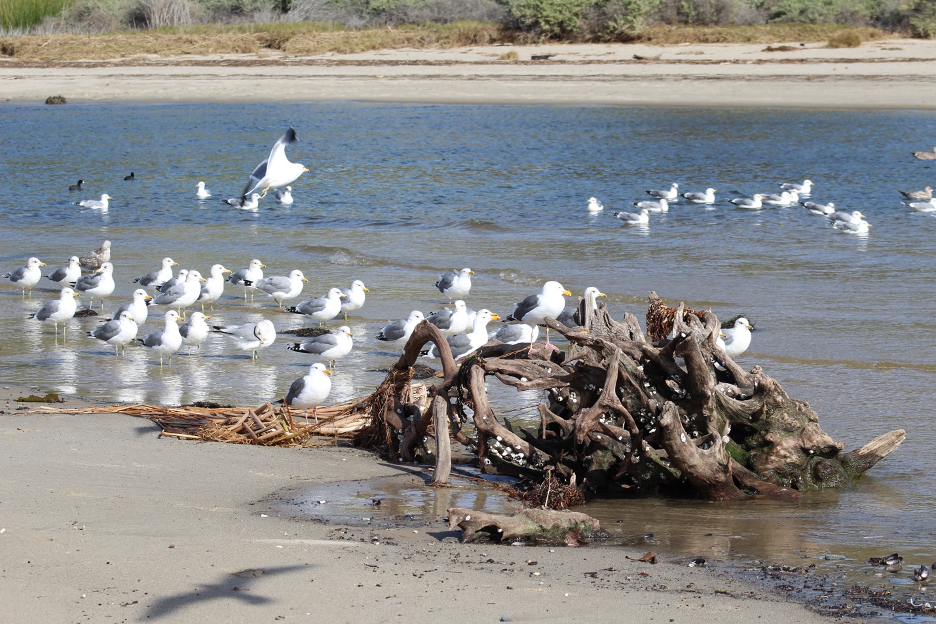
You will often notice birds (like planes) facing and flying into the wind to get a quick lift when necessary. The shapes of their wings allow them to exploit a fluid dynamics physical law that scientists refer to as Bernoulli’s Principle. This is at Malibu Lagoon.