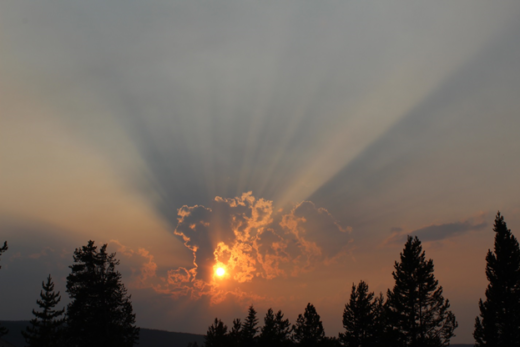
You’ve probably heard that strong and potentially historic El Niño conditions have developed in the Pacific as we enter our 2023-2024 winter storm season. But will nature perform as expected? We will only know several months after this November story is posted.
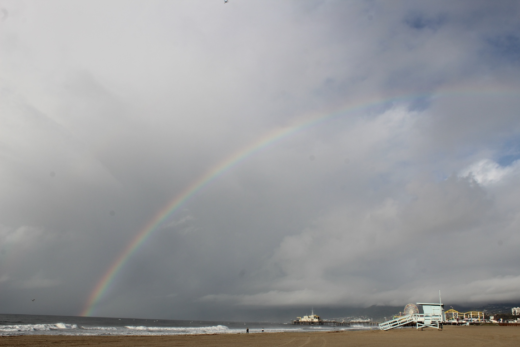
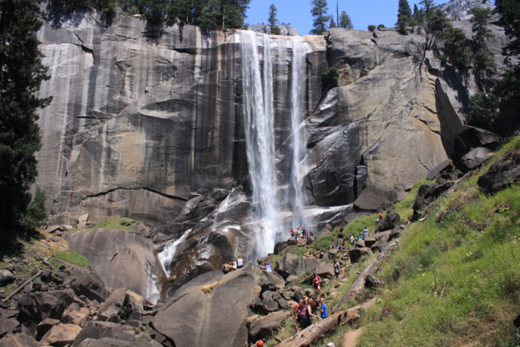
During El Niño years, the trade winds weaken, allowing warm ocean waters near the equator to drift from the western Pacific Ocean into the eastern Pacific toward the South and Central American coast. Cooler waters in the western Pacific usually result in higher pressure, sinking air, and drought for those regions. Meanwhile, abnormally warm water pools into the eastern Pacific, causing lower pressure to form in rising, wet, unstable air masses that approach the west coast. This often results in above average precipitation (and sometimes flooding) from California down the coast to South America.
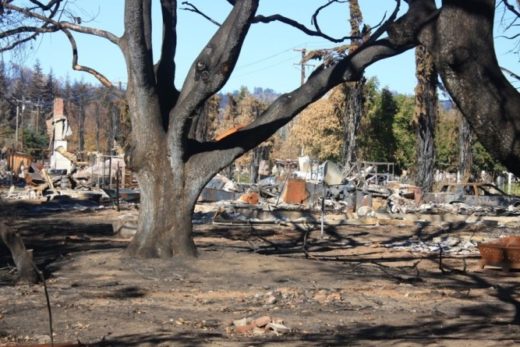
The greater difference between ocean water/atmosphere temperatures in the tropical Pacific and the northern Pacific during El Niño can help to shift winter’s jet streams and storm tracks farther south toward southern California and across the southern US. The corresponding atmospheric pressure shifts can form troughs of low pressure that entrain exceptionally wet air masses, dragging them across the Pacific and toward California. The result is that strong El Niño years are usually wetter than average in southern California and the southern US. Such patterns have produced some of the greatest floods in California history. (By contrast, when eastern Pacific waters cool during La Niña years, drought usually results in southern California.) But especially during the last several years, El Niño and La Niña haven’t always performed as expected. For instance, last year’s record drought-busting precipitation and floods in central California occurred during a rare “triple-dip” La Niña “three-peat”, as a third straight year of colder-than-average eastern Pacific waters finally came to a close.
That is why you see words such as “usually” and “on average” used by meteorologists and climatologists when anticipating weather patterns produced by ENSO (El Niño-Southern Oscillation) cycles. So as we get excited and watch all the media hype build during this strong El Niño year, there are plenty of unknowns that will be determined by how fickle pressure patterns respond to these changes in the tropical Pacific. And as climate change continues to challenge our ability to forecast trends that might have been more predicable in decades past, we must recognize that our atmosphere is charged up with the greatest amounts of energy producing the highest global temperatures in weather recording history. As we have learned from these weather whiplash stories that have energized our project and decorated our website over the years, we should remain prepared for a range of possible extremes.
You can click to the original sources for all this ocean-atmospheric science monitoring and prediction here: NOAA or NOAA.
And click here to find some explanations and additional graphics that might help cast some light on this season’s ENSO mysteries.

Compare and contrast the above early November, 2023 map (from the NOAA Climate Prediction Center) with the NASA Worldview map from early November 1997 (below), which marked the beginning of one of the most powerful and destructive El Niño years in history…and then check out this JPL/NASA site.

Professor Jing Liu also shared this research suggesting how climate change is impacting El Niño/La Niña cycles.
Keep your seat belts fastened!